最近生产环境一套数据库因为疯狂写日志数据,造成主键值溢出的情况出现,因此有必要将这个指标监控起来。
mysqld_exporter自带的这个功能,下面是我使用的启动参数:
nohup ./mysqld_exporter --config.my-cnf="./my.cnf" --web.listen-address=":9104" --collect.heartbeat --collect.auto_increment.columns --collect.binlog_size --collect.engine_innodb_status --collect.engine_tokudb_status --collect.slave_hosts --collect.slave_status --collect.info_schema.processlist --collect.info_schema.innodb_metrics > /dev/null 2>1
红色高亮的参数,就是用来采集到自增id的使用情况的。
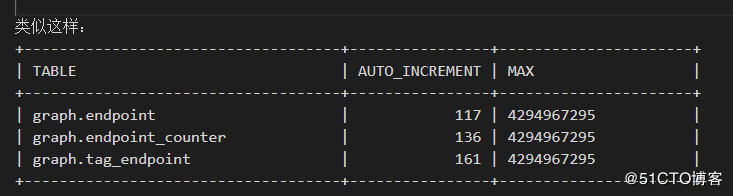
实际上执行的类似这个SQL:
SELECT
 table_schema,
 table_name,
 column_name,
 AUTO_INCREMENT,
 POW(2, CASE data_type
   WHEN 'tinyint'  THEN 7
   WHEN 'smallint' THEN 15
   WHEN 'mediumint' THEN 23
   WHEN 'int'    THEN 31
   WHEN 'bigint'  THEN 63
   END+(column_type LIKE '% unsigned'))-1 AS max_int
  FROM information_schema.tables t
   JOIN information_schema.columns c USING (table_schema,table_name)
  WHERE
   c.extra = 'auto_increment'
  AND
   t.TABLE_SCHEMA NOT IN ('information_schema','mysql', 'sys','test','performance_schema')
  AND
   t.auto_increment IS NOT NULL ;
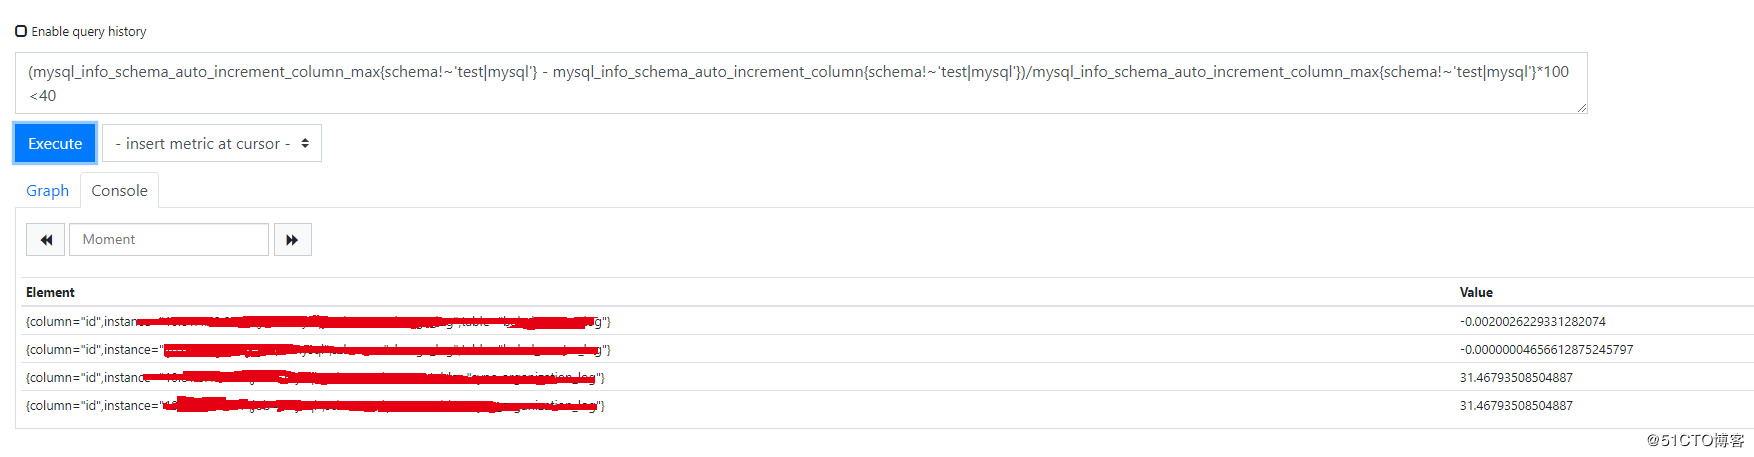
在prometheus的web界面,我们可以测试编写如下的promql, 找出剩余自增id可以率少于40%的实例的库+表名
(mysql_info_schema_auto_increment_column_max{schema!~'test|mysql'} - mysql_info_schema_auto_increment_column{schema!~'test|mysql'})/mysql_info_schema_auto_increment_column_max{schema!~'test|mysql'}*100 40
取到数据后,我们可以在alertmanager里面配置相关的告警,或者再grafana上面绘制图,如下:

到此这篇关于使用prometheus统计MySQL自增主键的剩余可用百分比的文章就介绍到这了,更多相关prometheus统计MySQL自增主键内容请搜索脚本之家以前的文章或继续浏览下面的相关文章希望大家以后多多支持脚本之家!
您可能感兴趣的文章:- 使用Grafana+Prometheus监控mysql服务性能
- 利用Prometheus与Grafana对Mysql服务器的性能监控详解
- SpringBoot使用prometheus监控的示例代码
- springboot2.X整合prometheus监控的实例讲解
- SpringBoot+Prometheus+Grafana实现应用监控和报警的详细步骤
- Prometheus的安装和配置教程详解
- Prometheus 入门教程之SpringBoot 实现自定义指标监控
- Prometheus开发中间件Exporter过程详解
- springboot集成普罗米修斯(Prometheus)的方法
- 使用 prometheus python 库编写自定义指标的方法(完整代码)
- 使用Prometheus+Grafana的方法监控Springboot应用教程详解
- Prometheus 监控MySQL使用grafana展示


 咨 询 客 服