我也不知道这玩意主要是干啥用的
实现如下
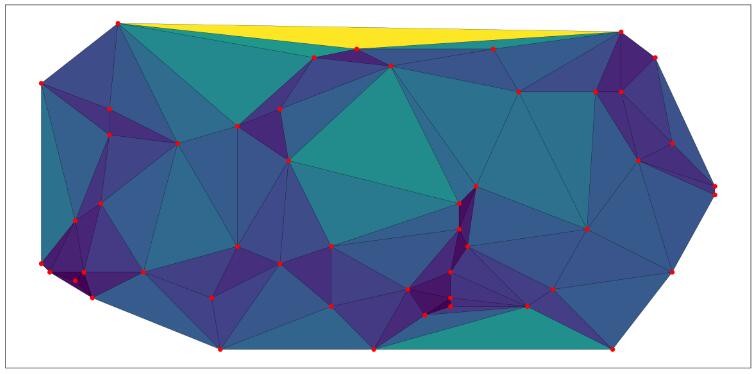
我用剖分的三角形的三个顶点到中心点的距离和作为颜色, 结果显示: 点越密集的地方, 图片上的颜色越深。
from scipy.spatial import Delaunay
import numpy as np
import matplotlib.pyplot as plt
width = 80
height = 40
pointNumber = 50
points = np.zeros((pointNumber, 2))
points[:, 0] = np.random.randint(0, width, pointNumber)
points[:, 1] = np.random.randint(0, height, pointNumber)
tri = Delaunay(points)
center = np.sum(points[tri.simplices], axis=1)/3.0
'''
color = []
for sim in points[tri.simplices]:
    x1, y1 = sim[0][0], sim[0][1]
    x2, y2 = sim[1][0], sim[1][1]
    x3, y3 = sim[2][0], sim[2][1]

    s = ((x1-x2)**2+(y1-y2)**2)**0.5 + ((x1-x3)**2+(y1-y3)**2)**0.5 + ((x3-x2)**2+(y3-y2)**2)**0.5
    color.append(s)
color = np.array(color)
'''
color = []
for index, sim in enumerate(points[tri.simplices]):
    cx, cy = center[index][0], center[index][1]
    x1, y1 = sim[0][0], sim[0][1]
    x2, y2 = sim[1][0], sim[1][1]
    x3, y3 = sim[2][0], sim[2][1]

    s = ((x1-cx)**2+(y1-cy)**2)**0.5 + ((cx-x3)**2+(cy-y3)**2)**0.5 + ((cx-x2)**2+(cy-y2)**2)**0.5
    color.append(s)
color = np.array(color)
plt.figure(figsize=(20, 10))
plt.tripcolor(points[:, 0], points[:, 1], tri.simplices.copy(), facecolors=color, edgecolors='k')
plt.tick_params(labelbottom='off', labelleft='off', left='off', right='off', bottom='off', top='off')
ax = plt.gca()
plt.scatter(points[:,0],points[:,1], color='r')
#plt.grid()
plt.savefig('Delaunay.png', transparent=True, dpi=600)
补充:生长算法实现点集的三角剖分( Python(Tkinter模块))
关于三角剖分
假设V是二维实数域上的有限点集,边e是由点集中的点作为端点构成的封闭线段, E为e的集合。那么该点集V的一个三角剖分T=(V,E)是一个平面图G,该平面图满足条件:
1.除了端点,平面图中的边不包含点集中的任何点。
2.没有相交边。
3.平面图中所有的面都是三角面,且所有三角面的合集是散点集V的凸包。
在实际中运用的最多的三角剖分是Delaunay三角剖分,它是一种特殊的三角剖分。
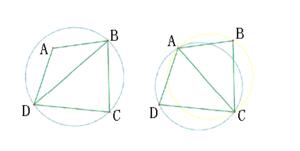
【定义】Delaunay边:假设E中的一条边e(两个端点为a,b),e若满足下列条件,则称之为Delaunay边:
存在一个圆经过a,b两点,圆内(注意是圆内,圆上最多三点共圆)不含点集V中任何其他的点,这一特性又称空圆特性。
【定义】Delaunay三角剖分:如果点集V的一个三角剖分T只包含Delaunay边,那么该三角剖分称为Delaunay三角剖分。
关于Delaunay三角剖分算法可以参考百度百科Delaunay三角剖分算法
我做三角剖分的目的——构建TIN,不规则三角网
不规则三角网(TIN)是DEM的重要形式之一,相较于规则格网,其具有数据冗余小、细节丢失少的特点。
在分布不规则的高程点之间构建出三角网,其关键技术就是三角剖分

算法步骤
1、首先任选一点,在点集中找出距离改点最近的点连成一条线,以该线为基线。
2、在所有点中寻找能与该基线构成具有空圆性三角形的点,并构成三角形。
3、以新生成的边为基线,重复第二步,直至点集构网完成。
具体代码如下
所使用的python版本为python3.6,编辑器为Pycharm2018.3.1
#-*- coding:utf-8 -*-
import tkinter
from tkinter import filedialog
import csv
#根据两点坐标计算距离
def caldis(x1,y1,x2,y2):
    return ((x1-x2)**2+(y1-y2)**2)**0.5
#输入三角形三个顶点,计算外接圆圆心及半径
def calcenter(x1,y1,x2,y2,x3,y3):
    y1=-y1  #计算公式是根据平面直角坐标推算的,原点在左下角,但是计算机屏幕坐标原点在右上角,所以计算式y坐标取负
    y2=-y2
    y3=-y3
    if (y1 != y3 and y1 != y2 and y2 != y3): #判断是否有y坐标相等,即三角形某边斜率为0的情况,避免出现坟分母为0的错误
        if(((x3-x1)/(y3-y1))-((x2-x1)/(y2-y1)))==0:
            x2=x2+1
        x=(((y1+y3)/2)+((x1+x3)/2)*((x3-x1)/(y3-y1))-((y1+y2)/2)-((x1+x2)/2)*((x2-x1)/(y2-y1)))/(((x3-x1)/(y3-y1))-((x2-x1)/(y2-y1)))
        y=-((x3-x1)/(y3-y1))*x+((y1+y3)/2)+(((x1+x3)/2)*((x3-x1)/(y3-y1)))
        return (x, -y, caldis(x, y, x1, y1))
    elif (y1 == y3 and y1 != y2 and y2 != y3):#若存在斜率为0的边则计算可简化
        x=(x1+x3)/2
        y=-((x2-x1)/(y2-y1))*x+((y1+y2)/2)+((x2-x1)/(y2-y1))*((x1+x2)/2)
        return (x, -y, caldis(x, y, x1, y1)) #返回值为元组(圆心横坐标x,圆心纵坐标y,外接圆半径r),计算出来的y值要返回屏幕坐标所以再次取负
    elif (y1 != y3 and y1 == y2 and y2 != y3):
        x = (x1 + x2) / 2
        y = -((x3 - x1) / (y3 - y1)) * x + ((y1 + y3) / 2) + ((x3 - x1) / (y3 - y1)) * ((x1 + x3) / 2)
        return (x, -y, caldis(x, y, x1, y1))
    elif (y1 != y3 and y1 != y2 and y2 == y3):
        x = (x3 + x2) / 2
        y = -((x3 - x1) / (y3 - y1)) * x + ((y1 + y3) / 2) + ((x3 - x1) / (y3 - y1)) * ((x1 + x3) / 2)
        return (x, -y, caldis(x, y, x1, y1))
    else:
        return None
class getTIN: #定义窗口及操作类
    def __init__(self):
        self.path=str() #坐标文件路径
        self.pointlist=[] #存放所有点坐标的列表
        self.linelist=[] #存放线的列表,每条线用两个点号表示连线
        self.tk=tkinter.Tk() #定义主窗口
        self.tk.title('MyTIN')
        self.tk.geometry('1200x720')
        self.shengzhang=tkinter.Button(self.tk,text='生长算法',width=15,command=self.drawTIN_shengzhang)
        self.shengzhang.place(x=1050,y=100)  #定义按钮,关联到生长算法计算TIN的的函数
        self.readin=tkinter.Button(self.tk,text='读入坐标文件',width=15,command=self.getfile)
        self.readin.place(x=1050,y=50)
        self.can=tkinter.Canvas(self.tk,width=950,height=620,bg='white')
        self.can.place(x=50,y=50)
        self.tk.mainloop()
    def getfile(self):  #选择坐标文件(*.csv),从文件中读入坐标存入pointlist列表并在绘图区展示出来
        self.path=filedialog.askopenfilename()
        f=open(self.path,'r')
        fd=csv.reader(f)
        self.pointlist=list(fd)
        for i in range(0,len(self.pointlist)):
            self.can.create_oval(int(self.pointlist[i][0])-2,int(self.pointlist[i][1])-2,int(self.pointlist[i][0])+2,int(self.pointlist[i][1])+2,fill='black')
            self.can.create_text(int(self.pointlist[i][0])+7,int(self.pointlist[i][1])-7,text=str(i))
    def drawTIN_shengzhang(self):
        j = 1
        k = 0
        mindis = ((int(self.pointlist[0][0]) - int(self.pointlist[1][0])) ** 2 + (int(self.pointlist[0][1]) - int(self.pointlist[1][1])) ** 2) ** 0.5
        x = len(self.pointlist)
        for i in range(1, x):
            dis = ((int(self.pointlist[0][0]) - int(self.pointlist[i][0])) ** 2 + (int(self.pointlist[0][1]) - int(self.pointlist[i][1])) ** 2) ** 0.5
            if dis  mindis:
                mindis = dis
                j = i
        self.linelist.append((k,j)) #首先计算出距起始点(点号为0)距离最短的点,以这两点的连线作为基线开始生长
        self.shengzhangjixian(k,j)
    def drawTIN(self): #根据线文件在绘图区绘制出TIN
        for i in self.linelist:
            self.can.create_line(self.pointlist[i[0]][0], self.pointlist[i[0]][1], self.pointlist[i[1]][0], self.pointlist[i[1]][1])
    def shengzhangjixian(self,i,j): #根据某一基线开始生长的函数
        x = len(self.pointlist)
        for k in range(0,x): #遍历没一个点,判断是否与基线构成D三角形
            n = 0 #n用于统计外接圆内的点数
            if ((k,i) not in self.linelist) and ((i,k) not in self.linelist) and ((j,k) not in self.linelist) and ((k,j) not in self.linelist):
                for y in range(0,x): #遍历每一个点,判断
                    if y==i or y==j or y==k:
                        continue
                    if(calcenter(int(self.pointlist[i][0]),int(self.pointlist[i][1]),int(self.pointlist[j][0]),int(self.pointlist[j][1]),int(self.pointlist[k][0]),int(self.pointlist[k][1]))==None):
                        continue
                    else:
                        xyr=calcenter(int(self.pointlist[i][0]),int(self.pointlist[i][1]),int(self.pointlist[j][0]),int(self.pointlist[j][1]),int(self.pointlist[k][0]),int(self.pointlist[k][1]))
                    if caldis(xyr[0],xyr[1],int(self.pointlist[y][0]),int(self.pointlist[y][1]))  xyr[2]: #判断点是否在外接圆内
                        n=n+1
                    else:
                        continue
            else:continue
            if n == 0: #判断是否为D三角形
                self.linelist.append((k,i)) #将新生成的边的端点号加入线列表
                self.drawTIN() #调用绘制函数绘制TIN
                self.shengzhangjixian(k,i) #以生成的新边作为基线,迭代计算
                self.linelist.append((k,j))
                self.drawTIN()
                self.shengzhangjixian(k,j)
            else:continue
if __name__ == '__main__':
    MyTIN=getTIN()
通过如下代码生成一组随机的点并存入文件
import random
import csv
from tkinter import filedialog
path=filedialog.askopenfilename()
OutAddress=open(path,'a',newline='')
csv_write = csv.writer(OutAddress,dialect='excel')
for i in range(0,20):
    x=random.randint(30,920)
    y=random.randint(30,590)
    out=(x,y)
    print(out)
    csv_write.writerow(out)
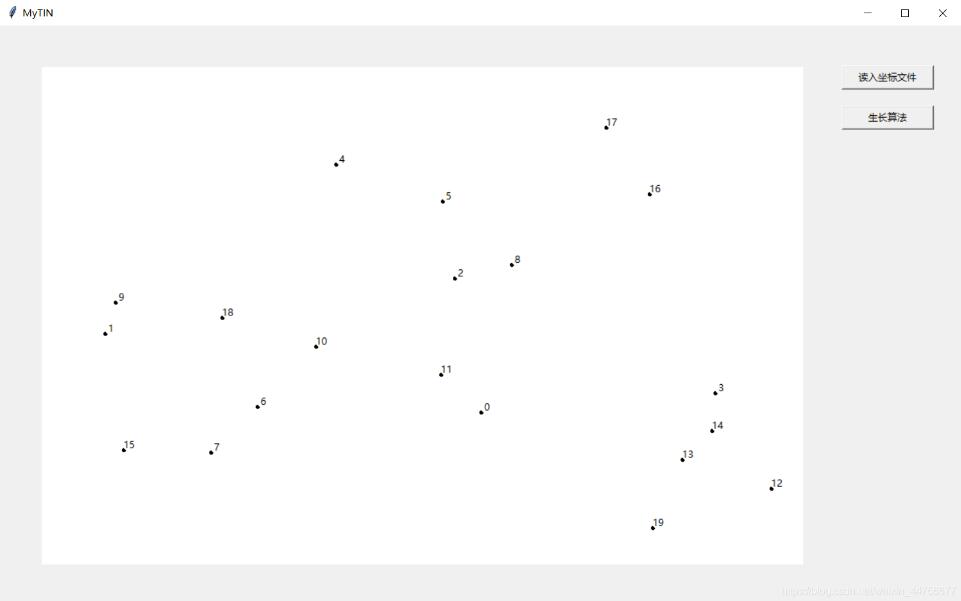
通过上面的程序我们得到一组坐标如下
550,432
81,334
517,265
842,408
369,123
502,169
271,425
213,482
588,248
94,295
344,350
500,385
912,527
801,491
838,455
104,479
760,160
706,77
227,314
764,576
将以上的点在界面中展示出来
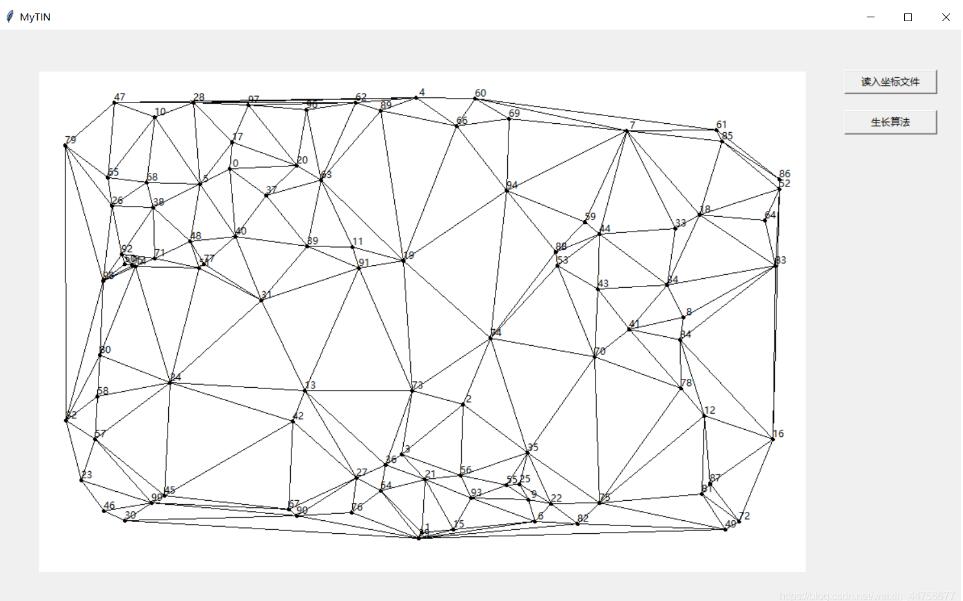
点击生长算法运行得到结果
小结
生长算法在三角剖分算法中并不是什么高效的算法,其特点在于算法简单易行,但是计算量大,并且对于新插入的点无法更新,必须重新计算。
相比之下,逐点插入算法虽然计算量仍然较大(似乎三角剖分计算量都不小),但是能实现对新插入点的更新而不用重头计算。
注:文中部分图片及介绍来自百度百科。
以上为个人经验,希望能给大家一个参考,也希望大家多多支持脚本之家。如有错误或未考虑完全的地方,望不吝赐教。
您可能感兴趣的文章:- 用Python生成N层的杨辉三角的实现方法
- python实现杨辉三角的几种方法代码实例
- 使用Python三角函数公式计算三角形的夹角案例
- 使用python计算三角形的斜边例子
- python 已知三条边求三角形的角度案例
- python实现输入三角形边长自动作图求面积案例
- Python3如何判断三角形的类型
- Python判断三段线能否构成三角形的代码


 咨 询 客 服