1. 从官网选择Prometheus版本进行下载
官网地址>> https://github.com/prometheus/prometheus/releases/
2. 实验安排
在主机192.168.153.137上安装prometheus监控192.168.153.138上的mysql服务和主机状态
3. 上传软件包到137服务器并配置
3.1 将软件包解压到 /usr/local 目录下
tar xzf prometheus-2.24.1.linux-amd64.tar.gz -C /usr/local/
3.2 给目录创建软链接
ln -s /usr/local/prometheus-2.24.1.linux-amd64/ /usr/local/prometheus
3.3 切换到目录下
3.4 修改配置文件 prometheus.yml,配置要监控的项
scrape_configs:
 # The job name is added as a label `job=job_name>` to any timeseries scraped from this config.
 - job_name: 'prometheus'

 # metrics_path defaults to '/metrics'
 # scheme defaults to 'http'.

 static_configs:
 - targets: ['localhost:9090']
 #监控Linux主机状态
 - job_name: 'linux'
 static_configs:
 - targets: ['192.168.153.138:9100']
 #监控mysql服务状态
 - job_name: 'mysql'
 static_configs:
 - targets: ['192.168.153.138:9104']
3.5 启动promethus服务
./prometheus --config.file=prometheus.yml
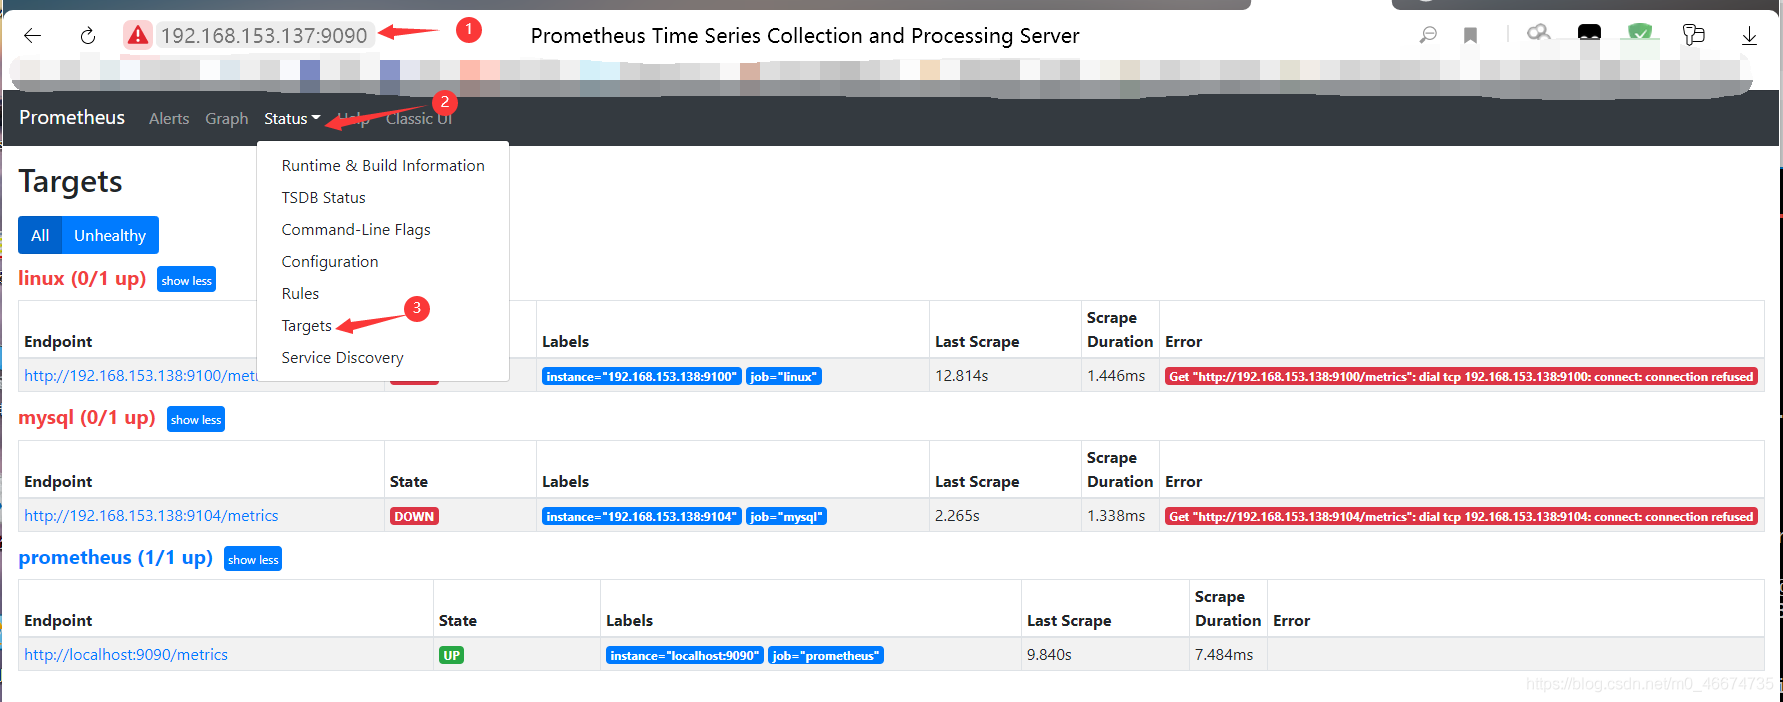
3.6 浏览器输入 IP:9090 查看
在Status->Targets页面下,我们可以看到我们配置的两个Target,它们的State为DOWN。
4. 配置138主机 4.1 下载exporter
下载地址>> https://github.com/prometheus/node_exporter/releases
4.2 将软件包解压到 /usr/local 目录下
tar xzf node_exporter-1.0.1.linux-amd64.tar.gz -C /usr/local/
4.3 启动exporter
nohup /usr/local/node_exporter-1.0.1.linux-amd64/node_exporter
4.4 下载mysqld_exporter
下载地址>> https://github.com/prometheus/mysqld_exporter/releases
4.5 将软件包解压到 /usr/local 目录下
tar xzf mysqld_exporter-0.12.1.linux-amd64.tar.gz -C /usr/local/
4.6 数据库给mysqld_exporter授权
[root@host-138 ~]# mysql
Welcome to the MariaDB monitor. Commands end with ; or \g.

MariaDB [(none)]> GRANT REPLICATION CLIENT,PROCESS ON *.* TO 'mysql_monitor'@'localhost' identified by 'mysql_monitor';
Query OK, 0 rows affected (0.00 sec)

MariaDB [(none)]> GRANT SELECT ON *.* TO 'mysql_monitor'@'localhost';
Query OK, 0 rows affected (0.00 sec)
4.7 创建 .my.cnf 配置文件
vim /usr/local/mysqld_exporter-0.12.1.linux-amd64/.my.cnf
内容为:
[client]
user=mysql_monitor
password=mysql_monitor
4.8 运行mysqld_exporter服务
nohup /usr/local/mysqld_exporter-0.12.1.linux-amd64/mysqld_exporter --config.my-cnf="/usr/local/mysqld_exporter-0.12.1.linux-amd64/.my.cnf"
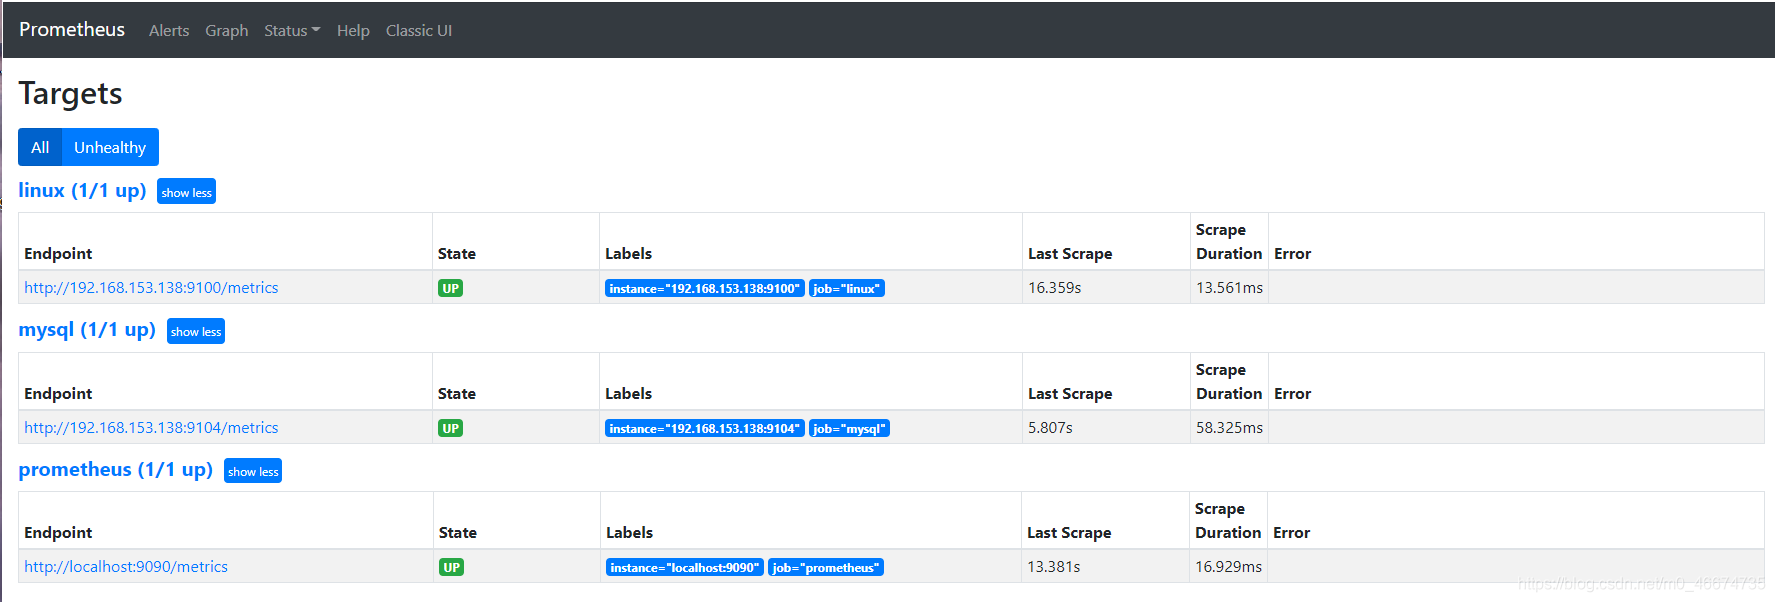
5. 在promethus页面刷新Status->Targets页面,可以看到配置的两个Target的State为UP:
5. 在137主机上安装部署grafana
安装教程链接>>https://www.jb51.net/article/204660.htm
5.1 添加promethus数据源 未完待续…
到此这篇关于Prometheus的安装和配置教程详解的文章就介绍到这了,更多相关Prometheus安装和配置内容请搜索脚本之家以前的文章或继续浏览下面的相关文章希望大家以后多多支持脚本之家!
您可能感兴趣的文章:- 使用Grafana+Prometheus监控mysql服务性能
- 利用Prometheus与Grafana对Mysql服务器的性能监控详解
- SpringBoot使用prometheus监控的示例代码
- springboot2.X整合prometheus监控的实例讲解
- SpringBoot+Prometheus+Grafana实现应用监控和报警的详细步骤
- Prometheus 入门教程之SpringBoot 实现自定义指标监控
- Prometheus开发中间件Exporter过程详解
- springboot集成普罗米修斯(Prometheus)的方法
- 使用 prometheus python 库编写自定义指标的方法(完整代码)
- 使用prometheus统计MySQL自增主键的剩余可用百分比
- 使用Prometheus+Grafana的方法监控Springboot应用教程详解
- Prometheus 监控MySQL使用grafana展示


 咨 询 客 服