下载地址
phpstudy:https://www.xp.cn/download.html
vscode:https://code.visualstudio.com/ 设置
phpstudy版本:7.3.4nts
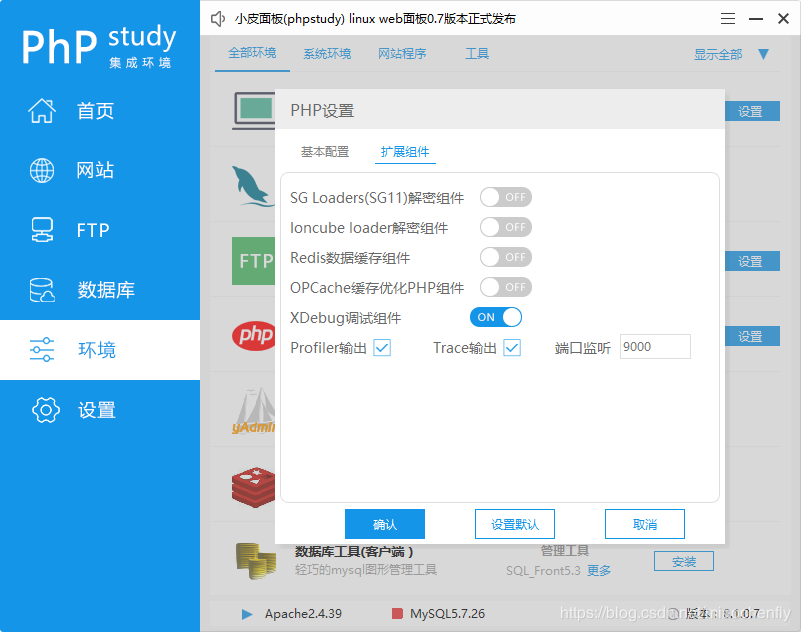
[Xdebug]
zend_extension=D:/phpstudy_pro/Extensions/php/php7.3.4nts/ext/php_xdebug.dll
xdebug.collect_params=1
xdebug.collect_return=1
xdebug.auto_trace=On
xdebug.trace_output_dir=D:/phpstudy_pro/Extensions/php_log/php7.3.4nts.xdebug.trace
xdebug.profiler_enable=On
xdebug.profiler_output_dir=D:/phpstudy_pro/Extensions/php_log/php7.3.4nts.xdebug.profiler
xdebug.remote_enable=On
xdebug.remote_autostart=On
xdebug.remote_host=localhost
xdebug.remote_port=9000
xdebug.remote_handler=dbgp
vscode :
ctrl+,调出setting,或则文件->首选项->设置
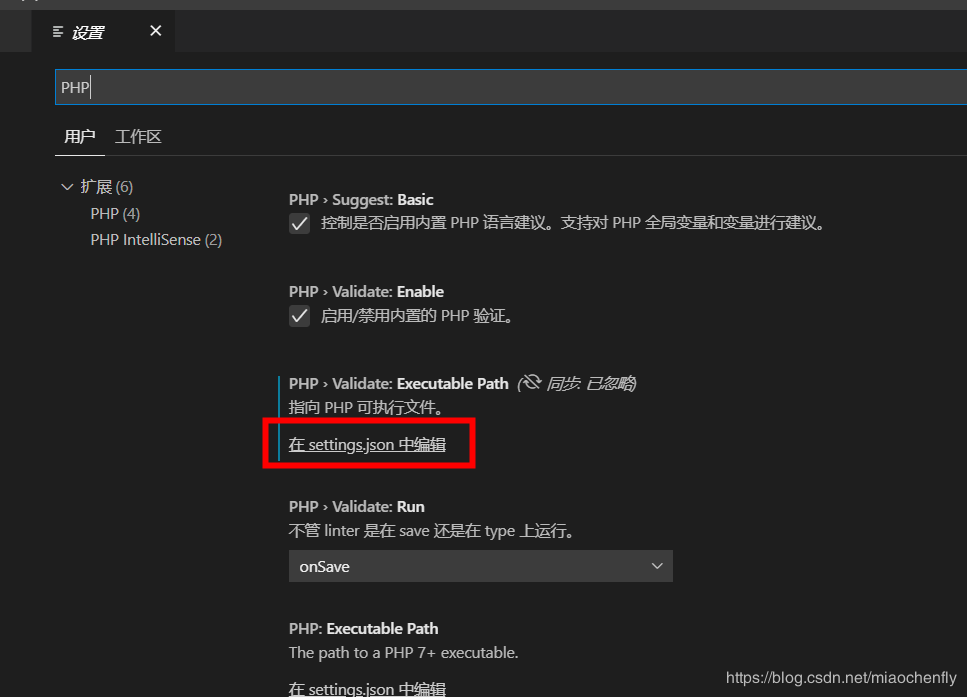
php路径设置
{
  "window.zoomLevel": 1,
  "git.confirmSync": false,
  "git.autofetch": true,
  "[javascript]": {
    "editor.defaultFormatter": "vscode.typescript-language-features"
  },
  //关键点
  "php.validate.executablePath": "D:/phpstudy_pro/Extensions/php/php7.3.4nts/php.exe"
}
Xdebug设置
{
  // 使用 IntelliSense 了解相关属性。
  // 悬停以查看现有属性的描述。
  // 欲了解更多信息,请访问: https://go.microsoft.com/fwlink/?linkid=830387
  "version": "0.2.0",
  "configurations": [
    {
      "name": "Listen for XDebug",
      "type": "php",
      "request": "launch",
      //端口
      "port": 9000
    },
    {
      "name": "Launch currently open script",
      "type": "php",
      "request": "launch",
      "program": "${file}",
      "cwd": "${fileDirname}",
      //端口
      "port": 9000
    }
  ]
}
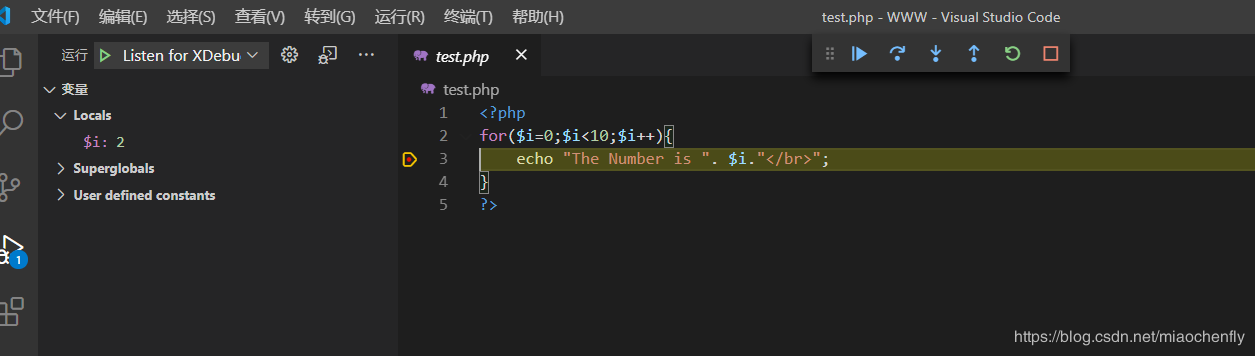
验证
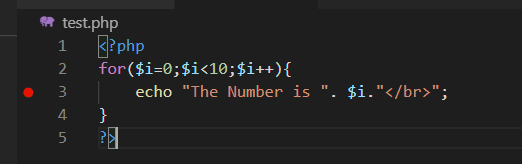
vscode F5启动调试
浏览器输入:localhost/test.php
到此这篇关于phpStudy vscode 搭建debug调试的教程详解的文章就介绍到这了,更多相关phpStudy vscode 搭建debug调试内容请搜索脚本之家以前的文章或继续浏览下面的相关文章希望大家以后多多支持脚本之家!
您可能感兴趣的文章:- Ubuntu下开启php调试模式报错信息解决办法
- 如何运行/调试你的PHP代码
- PHPStorm 2020.1 调试 Nodejs的多种方法详解
- PhpStorm+xdebug+postman调试技巧分享
- php开发最强大的IDE编辑的phpstorm 2020.2配置Xdebug调试的详细教程
- 解决windows上php xdebug 无法调试的问题
- Vagrant(WSL)+PHPStorm+Xdebu 断点调试环境搭建
- PhpStorm 如何优雅的调试Hyperf的方法步骤
- PHP如何打印跟踪调试信息


 咨 询 客 服