样式是定义图表可视化外观的配置,它由一组预置的rcParams参数构成。matplotlib预置了一系列样式风格,可直接使用。
样式使用方法
样式相关模块为style。
1. 显示本机可用样式
matplotlib.style.available返回本机可用样式的列表。
列表只读,样式更新后,需要使用reload_library()重新加载样式。
In [1]: import matplotlib.style as style
In [2]: style.available
Out[2]:
['Solarize_Light2',
 '_classic_test_patch',
 'bmh',
 'classic',
 'dark_background',
 'fast',
 'fivethirtyeight',
 'ggplot',
 'grayscale',
 'seaborn',
 'seaborn-bright',
 'seaborn-colorblind',
 'seaborn-dark',
 'seaborn-dark-palette',
 'seaborn-darkgrid',
 'seaborn-deep',
 'seaborn-muted',
 'seaborn-notebook',
 'seaborn-paper',
 'seaborn-pastel',
 'seaborn-poster',
 'seaborn-talk',
 'seaborn-ticks',
 'seaborn-white',
 'seaborn-whitegrid',
 'tableau-colorblind10']
2. 显示样式详细设置
matplotlib.style.library以字典的形式返回所有样式的定义,字典键为样式名称,键为定义样式的 RcParams对象。
字典对象也是只读的,更新样式后,需要使用reload_library()重新加载样式。
In [6]: style.library['fast']
Out[6]:
RcParams({'agg.path.chunksize': 10000,
     'path.simplify': True,
     'path.simplify_threshold': 1.0})
3. 重新加载样式
matplotlib.style.reload_library()重新加载样式。
4. 使用样式
matplotlib.style.use(style)将matplotlib的绘图样式设置为某种样式。
使用default样式可以将样式为恢复到默认样式。
该函数只会更新style中定义的rcParams配置,其余rcParams配置保持不变。
参数style有四种取值:
str:样式名称或者样式文件的路径/url。通过style.available查看可用的样式名称。dict:以rcParams配置项和值为键值对的字典。Path:指向样式文件的Path对象。list:样式支持组合使用,将多个样式配置配置放置在列表中,matplotlib将逐个执行列表中每个元素的配置,元素可以为str、Path或者dict,列表右边的元素会覆盖前面元素的配置。
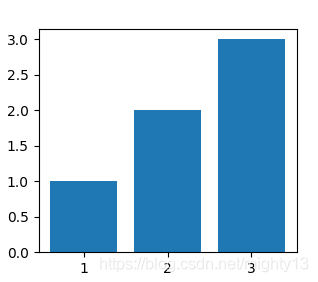
import matplotlib.pyplot as plt
plt.bar([1,2,3],[1,2,3])
plt.show()
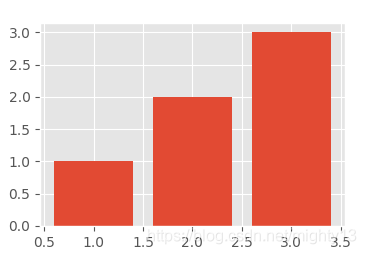
import matplotlib.pyplot as plt
plt.style.use('ggplot')
plt.bar([1,2,3],[1,2,3])
plt.show()
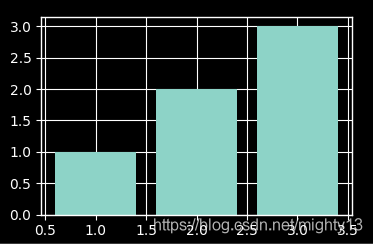
import matplotlib.pyplot as plt
plt.style.use(['ggplot','dark_background'])
plt.bar([1,2,3],[1,2,3])
plt.show()
import matplotlib.pyplot as plt
plt.subplot(221)
plt.bar([1,2,3],[1,2,3])
plt.style.use('ggplot')
plt.subplot(222)
plt.bar([1,2,3],[1,2,3])
plt.style.use('grayscale')
plt.subplot(223)
plt.bar([1,2,3],[1,2,3])
plt.style.use(['ggplot','grayscale'])
plt.subplot(224)
plt.bar([1,2,3],[1,2,3])
plt.show()
样式样例
参见https://matplotlib.org/gallery/style_sheets/style_sheets_reference.html
自定义样式
https://matplotlib.org/tutorials/introductory/customizing.html
到此这篇关于详解matplotlib绘图样式(style)初探的文章就介绍到这了,更多相关matplotlib绘图样式内容请搜索脚本之家以前的文章或继续浏览下面的相关文章希望大家以后多多支持脚本之家!
您可能感兴趣的文章:- 用Python的绘图库(matplotlib)绘制小波能量谱
- python matplotlib绘图实现删除重复冗余图例的操作
- python 绘图模块matplotlib的使用简介
- python之 matplotlib和pandas绘图教程
- Pyside2中嵌入Matplotlib的绘图的实现
- 详解matplotlib中pyplot和面向对象两种绘图模式之间的关系
- 解决使用Spyder IDE时matplotlib绘图的显示问题


 咨 询 客 服