matplotlib默认根据数据系列自动缩放坐标轴范围。pyplot模块中的autoscale函数可以切换是否自动缩放坐标轴范围,xlim()和ylim()函数可手动设置坐标轴范围。
autoscale函数
对于pyplot模块控制坐标轴范围是否自动缩放的函数为autoscale。
函数签名为matplotlib.pyplot.autoscale(enable=True, axis='both', tight=None)
参数作用及取值如下:
enable为布尔值,即是否自动缩放。axis取值范围为{'both', 'x', 'y'},默认值为'both',即作用在哪个坐标轴。tight为布尔值,默认值为None,即是否设置边距为0。
底层相关函数有:
- Axes.autoscale
- Axes.autoscale_view
- Axes.set_autoscale_on
- Axes.get_autoscale_on
- Axes.set_autoscalex_on
- Axes.get_autoscalex_on
- Axes.set_autoscaley_on
- Axes.get_autoscaley_on
案例
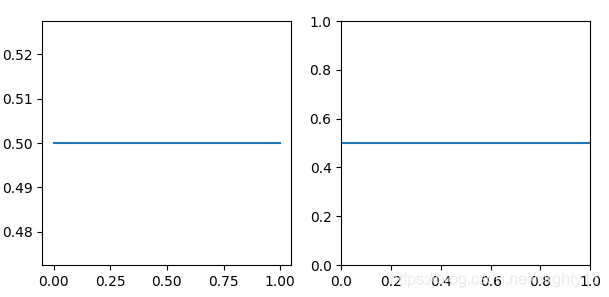
自动缩放坐标轴范围功能对比。
import matplotlib.pyplot as plt

plt.subplot(121)
plt.plot([0.5,0.5])
print(plt.gca().get_autoscale_on())
print(plt.gca().get_autoscalex_on())
print(plt.gca().get_autoscaley_on())
plt.subplot(122)
plt.plot([0.5,0.5])
plt.autoscale(False)
print(plt.gca().get_autoscale_on())
print(plt.gca().get_autoscalex_on())
print(plt.gca().get_autoscaley_on())
plt.show()
输出:
True
True
True
False
False
False
xlim()函数
手动设置x坐标轴的范围或获取x坐标轴的范围。
函数签名为matplotlib.pyplot.xlim(*args, **kwargs)。
调用签名有三种:
xlim((left, right))xlim(left, right)xlim(left=1, right=3)
其中left为x坐标轴左侧极值,right为x坐标轴右侧极值。注意!left可以比right大!
返回值为(left, right),即坐标轴范围元组。
xlim()相当于Axes.get_xlim,xlim(*args, **kwargs)相当于Axes.set_xlim。
案例
演示xlim()的调用方法。
import matplotlib.pyplot as plt

plt.figure(figsize=(14, 3))
plt.subplot(141)
plt.plot([1, 1])
print(plt.xlim())
plt.subplot(142)
plt.plot([1, 1])
plt.xlim(0, 1.5)
plt.annotate('plt.xlim(0,1.5)', (0.1, 1.001))
print(plt.xlim())
plt.subplot(143)
plt.plot([1, 1])
plt.xlim((0, 1.5))
plt.annotate('plt.xlim((0,1.5))', (0.1, 1.001))
print(plt.xlim())
plt.subplot(144)
plt.plot([1, 1])
plt.xlim(left=0, right=1.5)
plt.annotate('plt.xlim(left=0,right=1.5)', (0.1, 1.001))
print(plt.xlim())
plt.show()
输出:
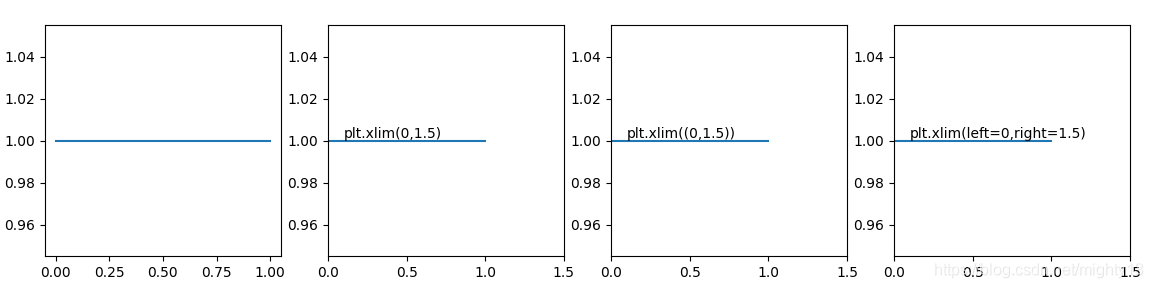
(-0.05, 1.05)
(0.0, 1.5)
(0.0, 1.5)
(0.0, 1.5)
ylim()函数
手动设置y坐标轴的范围或获取y坐标轴的范围。使用方法与xim()函数相似。
函数签名为matplotlib.pyplot.ylim(*args, **kwargs)。
调用签名有三种:
ylim((bottom, top))ylim(bottom, top)ylim(bottom=1, top=3)
其中bottom为x坐标轴左侧极值,top为x坐标轴右侧极值。注意!bottom可以比top大!
返回值为(bottom, top),即坐标轴范围元组。
ylim()相当于Axes.get_ylim,ylim(*args, **kwargs)相当于Axes.set_ylim。
案例
演示ylim()的调用方法。
import matplotlib.pyplot as plt

plt.figure(figsize=(14, 3))
plt.subplot(141)
plt.plot([1, 1])
print(plt.ylim())
plt.subplot(142)
plt.plot([1, 1])
plt.ylim(0, 1.5)
plt.annotate('plt.ylim(0,1.5)', (0.1, 1.01))
print(plt.ylim(0,1.5))
plt.subplot(143)
plt.plot([1, 1])
plt.ylim((0, 1.5))
plt.annotate('plt.ylim((0,1.5))', (0.1, 1.01))
print(plt.ylim())
plt.subplot(144)
plt.plot([1, 1])
plt.ylim(bottom=0, top=1.5)
plt.annotate('plt.ylim(bottom=0,top=1.5)', (0.1, 1.01))
print(plt.ylim())
plt.show()
输出:
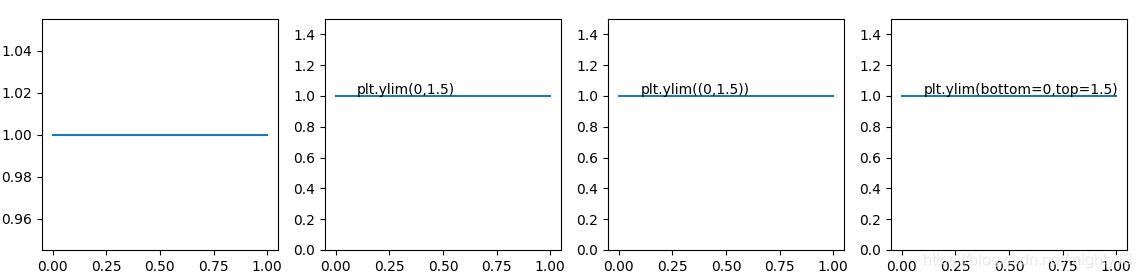
(0.945, 1.0550000000000002)
(0.0, 1.5)
(0.0, 1.5)
(0.0, 1.5)
到此这篇关于matplotlib之pyplot模块坐标轴范围设置(autoscale(),xlim(),ylim())的文章就介绍到这了,更多相关matplotlib 坐标轴范围内容请搜索脚本之家以前的文章或继续浏览下面的相关文章希望大家以后多多支持脚本之家!
您可能感兴趣的文章:- Python matplotlib学习笔记之坐标轴范围


 咨 询 客 服