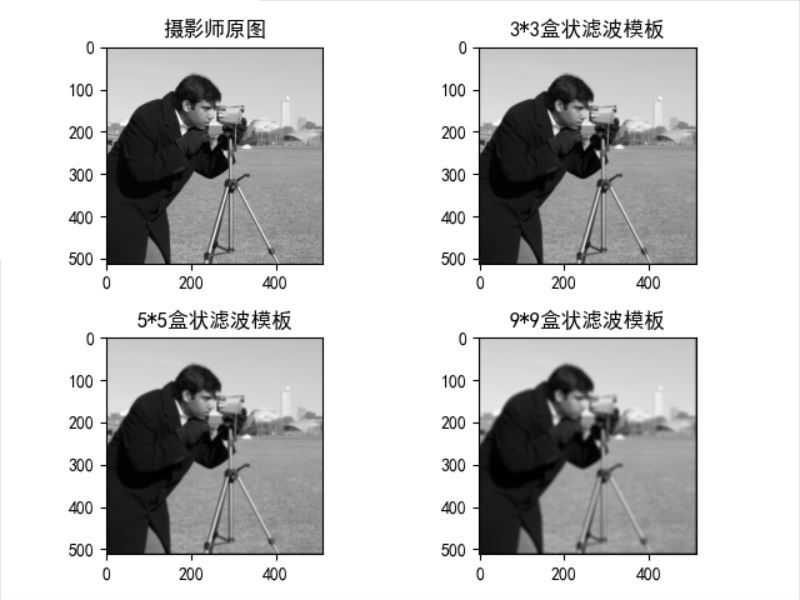
先上图
遇到的问题
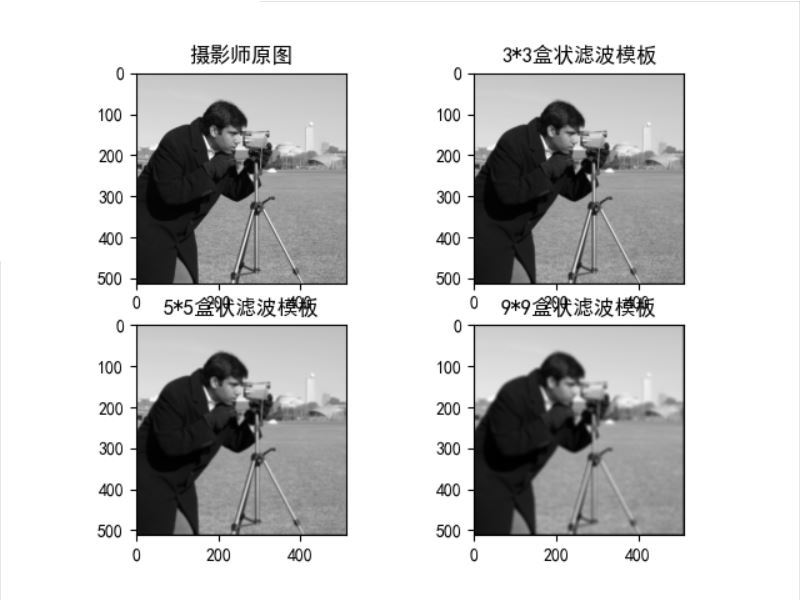
使用plt.subplots(2,2)绘图时,子图的标题和上图重叠,影响观感:
源代码:
import numpy as np
from scipy import signal
from skimage import data
from matplotlib import pyplot as plt

# 定义二维灰度图像的空间滤波函数
def correl2d(img, window):
	# 使用滤波器实现图像的空间相关
	# mode = 'same'表示输出尺寸等于输入尺寸
	# boundary = 'fill'表示滤波前,用常量值填充原始图像的边缘,默认常量值为0
	s = signal.correlate2d(img, window, mode='same', boundary='fill')
	return s.astype(np.uint8)
# img为原始图像
img = data.camera()
# 3*3盒状滤波模板
window_1 = np.ones((3, 3))/(3 ** 2)
# 5*5盒状滤波模板
window_2 = np.ones((5, 5))/(5 ** 2)
# 9*9盒状滤波模板
window_3 = np.ones((9, 9))/(9 ** 2)
# 生成滤波结果
new_img_1 = correl2d(img, window_1)
new_img_2 = correl2d(img, window_2)
new_img_3 = correl2d(img, window_3)
# 显示图像
plt.rcParams['font.sans-serif'] = ['SimHei'] # 中文
fig, axs = plt.subplots(2, 2)
axs[0, 0].imshow(img, cmap='gray')
axs[0, 0].set_title("摄影师原图")
axs[0, 1].imshow(new_img_1, cmap='gray')
axs[0, 1].set_title("3*3盒状滤波模板")
axs[1, 0].imshow(new_img_2, cmap='gray')
axs[1, 0].set_title("5*5盒状滤波模板")
axs[1, 1].imshow(new_img_3, cmap='gray')
axs[1, 1].set_title("9*9盒状滤波模板")
plt.show()
解决方法
方法1:在plt.show() 之前添加一句:
函数原型:
matplotlib.pyplot.tight_layout(*, pad=1.08, h_pad=None, w_pad=None, rect=None)
作用:调整subplots子图见的间距
Adjust the padding between and around subplots.
参数:
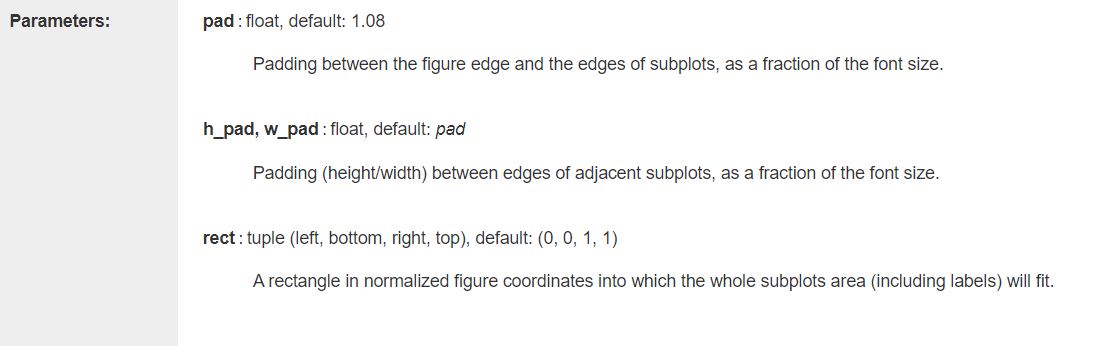
参考官方文档:https://matplotlib.org/stable/api/_as_gen/matplotlib.pyplot.tight_layout.html#matplotlib.pyplot.tight_layout
部分代码:
# 显示图像
plt.rcParams['font.sans-serif'] = ['SimHei'] # 中文
fig, axs = plt.subplots(2, 2)
axs[0, 0].imshow(img, cmap='gray')
axs[0, 0].set_title("摄影师原图")
axs[0, 1].imshow(new_img_1, cmap='gray')
axs[0, 1].set_title("3*3盒状滤波模板")
axs[1, 0].imshow(new_img_2, cmap='gray')
axs[1, 0].set_title("5*5盒状滤波模板")
axs[1, 1].imshow(new_img_3, cmap='gray')
axs[1, 1].set_title("9*9盒状滤波模板")
plt.tight_layout()
plt.show()
方法1测试结果:
方法2:在subplots中设置figsize
fig, axs = plt.subplots(2, 2,figsize=(6, 15))
# 显示图像
plt.rcParams['font.sans-serif'] = ['SimHei'] # 中文
# 设置figsize,防止图片重叠
fig, axs = plt.subplots(2, 2,figsize=(6, 15))
axs[0, 0].imshow(img, cmap='gray')
axs[0, 0].set_title("摄影师原图")
axs[0, 1].imshow(new_img_1, cmap='gray')
axs[0, 1].set_title("3*3盒状滤波模板")
axs[1, 0].imshow(new_img_2, cmap='gray')
axs[1, 0].set_title("5*5盒状滤波模板")
axs[1, 1].imshow(new_img_3, cmap='gray')
axs[1, 1].set_title("9*9盒状滤波模板")
方法2测试结果:

参考
[1]https://blog.csdn.net/txh3093/article/details/106401484
到此这篇关于python绘图使用subplots出现标题重叠的解决方法的文章就介绍到这了,更多相关python使用subplots绘图标题重叠内容请搜索脚本之家以前的文章或继续浏览下面的相关文章希望大家以后多多支持脚本之家!
您可能感兴趣的文章:- python中使用sys模板和logging模块获取行号和函数名的方法
- python绘图subplots函数使用模板的示例代码


 咨 询 客 服