有时候想要把几张图放在一起plot,比较好对比,subplot和subplots都可以实现,具体对比可以查看参考博文。这里用matplotlib库的subplot来举个栗子。
有两个数据段,第一个数据是DataFrame类型,第二个是ndarray类型。每个数据都有3列,我想画1*3的折线子图,第一个数据的第n列和第二个数据的第n列画在一张子图上。先来看一下两个数据长什么样儿(为显示方便,只看前5行)。
In [1]: testing_set.head()  # DataFrame类型
Out [1]:     Open    High     Low
		 0  778.81  789.63  775.80
		 1  788.36  791.34  783.16
		 2  786.08  794.48  785.02
		 3  795.26  807.90  792.20
		 4  806.40  809.97  802.83  # ndarray类型

In [2]: predicted_stock_price  #这里就只看前5行
Out [2]: [[790.6911  796.39215 779.3191 ]
 		 [790.24524 796.0866  778.9673 ]
 		 [789.5737  795.52606 778.3751 ]
		 [790.1047  796.10864 778.92395]
 		 [790.8686  796.94104 779.7281 ]]
# 创建画布
fig = plt.figure(figsize = (30,10), dpi = 80)
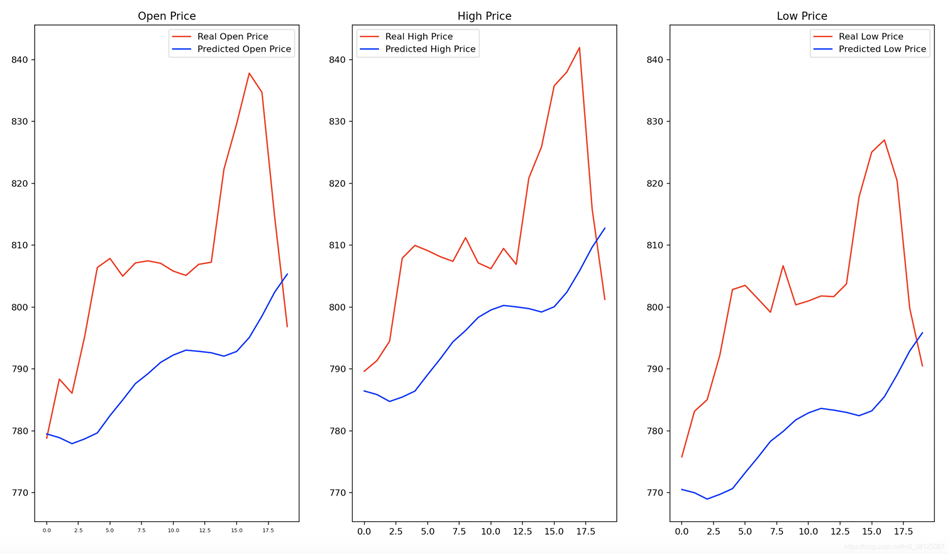
# 子图1
ax1 = plt.subplot(131)
ax1.set_title('Open Price')
ax1.plot(testing_set.values[:,0], color = 'red', label = 'Real Open Price')
ax1.plot(predicted_stock_price[:,0], color = 'blue', label = 'Predicted Open Price')
plt.setp(ax1.get_xticklabels(), fontsize=6)
ax1.legend()
# 子图2
ax2 = plt.subplot(132,sharey=ax1)
ax2.set_title('High Price')
ax2.plot(testing_set.values[:,1], color = 'red', label = 'Real High Price')
ax2.plot(predicted_stock_price[:,1], color = 'blue', label = 'Predicted High Price')
ax2.legend()
# 子图3
ax3 = plt.subplot(133,sharey=ax1)
ax3.set_title('Low Price')
ax3.plot(testing_set.values[:,2], color = 'red', label = 'Real Low Price')
ax3.plot(predicted_stock_price[:,2], color = 'blue', label = 'Predicted Low Price')
ax3.legend()
plt.show()
到此这篇关于matplotlib.subplot()画子图并共享y坐标轴的方法的文章就介绍到这了,更多相关matplotlib.subplot()子图内容请搜索脚本之家以前的文章或继续浏览下面的相关文章希望大家以后多多支持脚本之家!


 咨 询 客 服