目录
- 技术背景
- Two-Pass算法
- 测试数据的生成
- Two-Pass算法的实现
- 算法的执行流程
- 标签的重映射
- 其他的测试用例
- 总结概要
- 参考链接
技术背景
连通性检测是图论中常常遇到的一个问题,我们可以用五子棋的思路来理解这个问题五子棋中,横、竖、斜相邻的两个棋子,被认为是相连接的,而一样的道理,在一个二维的图中,只要在横、竖、斜三个方向中的一个存在相邻的情况,就可以认为图上相连通的。比如以下案例中的python数组,3号元素和5号元素就是相连接的,5号元素和6号元素也是相连接的,因此这三个元素实际上是属于同一个区域的:
array([[0, 3, 0],
       [0, 5, 0],
       [6, 0, 0]])
而再如下面这个例子,其中的1、2、3三个元素是相连的,4、5、6三个元素也是相连的,但是这两个区域不存在连接性,因此这个网格被分成了两个区域:
array([[1, 0, 4],
       [2, 0, 5],
       [3, 0, 6]])
那么如何高效的检测一张图片或者一个矩阵中的所有连通区域并打上标签,就是我们所关注的一个问题。
Two-Pass算法
一个典型的连通性检测的方案是Two-Pass算法,该算法可以用如下的一张动态图来演示:

该算法的核心在于用两次的遍历,为所有的节点打上分区的标签,如果是不同的分区,就会打上不同的标签。其基本的算法步骤可以用如下语言进行概述:
- 遍历网格节点,如果网格的上、左、左上三个格点不存在元素,则为当前网格打上新的标签,同时标签编号加一;
- 当上、左、左上的网格中存在一个元素时,将该元素值赋值给当前的网格作为标签;
- 当上、左、左上的网格中有多个元素时,取最低值作为当前网格的标签;
- 在标签赋值时,留意标签上边和左边已经被遍历过的4个元素,将4个元素中的最低值与这四个元素分别添加到Union的数据结构中(参考链接1);
- 再次遍历网格节点,根据Union数据结构中的值刷新网格中的标签值,最终得到划分好区域和标签的元素矩阵。
测试数据的生成
这里我们以Python3为例,可以用Numpy来产生一系列随机的0-1矩阵,这里我们产生一个20*20大小的矩阵:
# two_pass.py

import numpy as np
import matplotlib.pyplot as plt

if __name__ == "__main__":
    np.random.seed(1)
    graph = np.random.choice([0,1],size=(20,20))
    print (graph)

    plt.figure()
    plt.imshow(graph)
    plt.savefig('random_bin_graph.png')
执行的输出结果如下:
$ python3 two_pass.py
[[1 1 0 0 1 1 1 1 1 0 0 1 0 1 1 0 0 1 0 0]
 [0 1 0 0 1 0 0 0 1 0 0 0 1 1 1 1 1 0 0 0]
 [1 1 1 1 1 1 0 1 1 0 0 1 0 0 1 1 1 0 1 0]
 [0 1 1 0 1 1 1 1 0 0 1 1 0 0 0 0 1 1 1 0]
 [1 0 0 1 1 0 1 1 0 1 0 0 1 1 1 0 1 1 0 1]
 [1 1 1 0 0 0 0 0 1 1 1 1 1 1 1 0 0 0 0 0]
 [0 1 1 1 1 1 1 0 0 1 1 0 0 1 0 0 0 1 1 1]
 [1 1 0 1 0 1 0 0 0 1 1 1 0 1 0 0 0 0 1 0]
 [1 0 1 1 1 0 0 0 0 0 0 1 0 0 1 0 0 1 1 0]
 [0 0 1 0 0 0 0 1 0 0 0 0 1 1 0 0 1 1 1 0]
 [0 0 0 0 1 1 1 0 1 1 0 0 0 1 1 0 1 1 1 0]
 [1 1 1 1 0 1 0 0 1 0 1 0 1 1 0 1 1 0 1 1]
 [1 0 1 0 1 0 1 1 1 1 1 1 0 0 1 1 0 0 0 1]
 [1 0 0 0 0 0 1 1 1 1 1 1 1 0 0 1 0 0 0 1]
 [0 1 0 1 0 0 0 0 1 1 0 0 0 1 0 1 1 0 0 1]
 [0 1 0 0 0 1 0 1 0 1 1 1 0 1 0 1 1 1 1 0]
 [0 1 0 0 0 0 1 1 0 1 1 0 0 1 1 1 1 1 1 1]
 [0 0 0 0 0 0 0 1 0 0 0 0 0 1 1 1 1 0 0 0]
 [1 0 1 0 1 0 0 0 0 0 0 1 0 0 0 1 0 1 1 0]
 [0 1 1 0 1 0 1 0 1 1 0 0 1 0 0 0 0 0 1 1]]
同时会生成一张网格的图片:
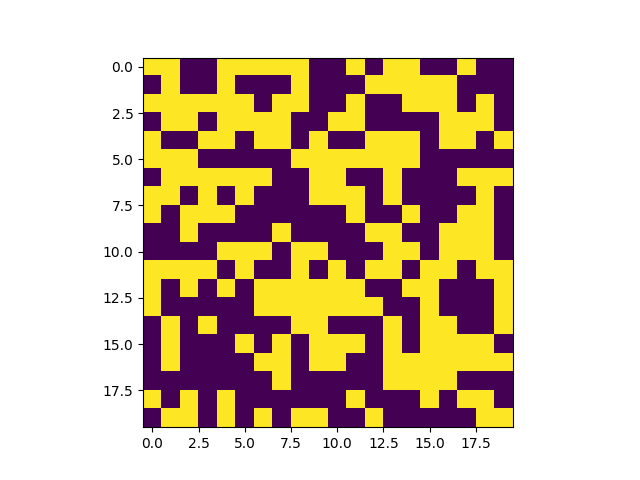
其实从这个图片中我们可以看出,图片的上面部分几乎都是连接在一起的,只有最下面存在几个独立的区域。
Two-Pass算法的实现
这里需要说明的是,因为我们并没有使用Union的数据结构,而是只使用了Python的字典数据结构,因此代码写起来会比较冗余而且不是那么美观,但是这里我们主要的目的是先用代解决这一实际问题,因此代码乱就乱一点吧。
# two_pass.py

import numpy as np
import matplotlib.pyplot as plt
from copy import deepcopy

def first_pass(g) -> list:
    graph = deepcopy(g)
    height = len(graph)
    width = len(graph[0])
    label = 1
    index_dict = {}
    for h in range(height):
        for w in range(width):
            if graph[h][w] == 0:
                continue
            if h == 0 and w == 0:
                graph[h][w] = label
                label += 1
                continue
            if h == 0 and graph[h][w-1] > 0:
                graph[h][w] = graph[h][w-1]
                continue
            if w == 0 and graph[h-1][w] > 0:
                if graph[h-1][w] = graph[h-1][min(w+1, width-1)]:
                    graph[h][w] = graph[h-1][w]
                    index_dict[graph[h-1][min(w+1, width-1)]] = graph[h-1][w]
                elif graph[h-1][min(w+1, width-1)] > 0:
                    graph[h][w] = graph[h-1][min(w+1, width-1)]
                    index_dict[graph[h-1][w]] = graph[h-1][min(w+1, width-1)]
                continue
            if h == 0 or w == 0:
                graph[h][w] = label
                label += 1
                continue
            neighbors = [graph[h-1][w], graph[h][w-1], graph[h-1][w-1], graph[h-1][min(w+1, width-1)]]
            neighbors = list(filter(lambda x:x>0, neighbors))
            if len(neighbors) > 0:
                graph[h][w] = min(neighbors)
                for n in neighbors:
                    if n in index_dict:
                        index_dict[n] = min(index_dict[n], min(neighbors))
                    else:
                        index_dict[n] = min(neighbors)
                continue
            graph[h][w] = label
            label += 1
    return graph, index_dict

def remap(idx_dict) -> dict:
    index_dict = deepcopy(idx_dict)
    for id in idx_dict:
        idv = idx_dict[id]
        while idv in idx_dict:
            if idv == idx_dict[idv]:
                break
            idv = idx_dict[idv]
        index_dict[id] = idv
    return index_dict

def second_pass(g, index_dict) -> list:
    graph = deepcopy(g)
    height = len(graph)
    width = len(graph[0])
    for h in range(height):
        for w in range(width):
            if graph[h][w] == 0:
                continue
            if graph[h][w] in index_dict:
                graph[h][w] = index_dict[graph[h][w]]
    return graph

def flatten(g) -> list:
    graph = deepcopy(g)
    fgraph = sorted(set(list(graph.flatten())))
    flatten_dict = {}
    for i in range(len(fgraph)):
        flatten_dict[fgraph[i]] = i
    graph = second_pass(graph, flatten_dict)
    return graph

if __name__ == "__main__":
    np.random.seed(1)
    graph = np.random.choice([0,1],size=(20,20))
    graph_1, idx_dict = first_pass(graph)
    idx_dict = remap(idx_dict)
    graph_2 = second_pass(graph_1, idx_dict)
    graph_3 = flatten(graph_2)
    print (graph_3)

    plt.subplot(131)
    plt.imshow(graph)
    plt.subplot(132)
    plt.imshow(graph_3)
    plt.subplot(133)
    plt.imshow(graph_3>0)
    plt.savefig('random_bin_graph.png')
完整代码的输出如下所示:
$ python3 two_pass.py
[[1 1 0 0 1 1 1 1 1 0 0 1 0 1 1 0 0 1 0 0]
 [0 1 0 0 1 0 0 0 1 0 0 0 1 1 1 1 1 0 0 0]
 [1 1 1 1 1 1 0 1 1 0 0 1 0 0 1 1 1 0 1 0]
 [0 1 1 0 1 1 1 1 0 0 1 1 0 0 0 0 1 1 1 0]
 [1 0 0 1 1 0 1 1 0 1 0 0 1 1 1 0 1 1 0 1]
 [1 1 1 0 0 0 0 0 1 1 1 1 1 1 1 0 0 0 0 0]
 [0 1 1 1 1 1 1 0 0 1 1 0 0 1 0 0 0 1 1 1]
 [1 1 0 1 0 1 0 0 0 1 1 1 0 1 0 0 0 0 1 0]
 [1 0 1 1 1 0 0 0 0 0 0 1 0 0 1 0 0 1 1 0]
 [0 0 1 0 0 0 0 1 0 0 0 0 1 1 0 0 1 1 1 0]
 [0 0 0 0 1 1 1 0 1 1 0 0 0 1 1 0 1 1 1 0]
 [1 1 1 1 0 1 0 0 1 0 1 0 1 1 0 1 1 0 1 1]
 [1 0 1 0 1 0 1 1 1 1 1 1 0 0 1 1 0 0 0 1]
 [1 0 0 0 0 0 1 1 1 1 1 1 1 0 0 1 0 0 0 1]
 [0 1 0 2 0 0 0 0 1 1 0 0 0 1 0 1 1 0 0 1]
 [0 1 0 0 0 1 0 1 0 1 1 1 0 1 0 1 1 1 1 0]
 [0 1 0 0 0 0 1 1 0 1 1 0 0 1 1 1 1 1 1 1]
 [0 0 0 0 0 0 0 1 0 0 0 0 0 1 1 1 1 0 0 0]
 [3 0 3 0 4 0 0 0 0 0 0 5 0 0 0 1 0 1 1 0]
 [0 3 3 0 4 0 6 0 7 7 0 0 5 0 0 0 0 0 1 1]]
同样的我们可以看看此时得到的新的图像:
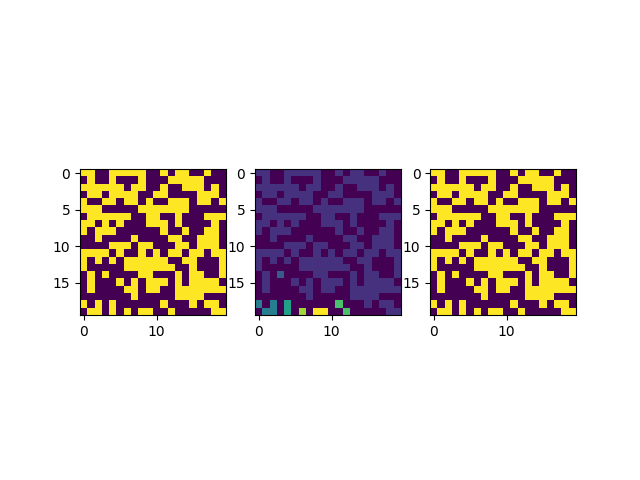
这里我们并列的画了三张图,第一张图是原图,第二张图是划分好区域和标签的图,第三张是对第二张图进行二元化的结果,以确保在运算过程中没有丢失原本的信息。经过确认这个标签的结果划分是正确的,但是因为涉及到一些算法实现的细节,这里我们还是需要展开来介绍一下。
算法的执行流程
if __name__ == "__main__":
    np.random.seed(1)
    graph = np.random.choice([0,1],size=(20,20))
    graph_1, idx_dict = first_pass(graph)
    idx_dict = remap(idx_dict)
    graph_2 = second_pass(graph_1, idx_dict)
    graph_3 = flatten(graph_2)
这个部分是算法的核心框架,在本文中的算法实现流程为:先用first_pass遍历一遍网格节点,按照上一个章节中介绍的Two-Pass算法打上标签,并获得一个映射关系;然后用remap将上面得到的映射关系做一个重映射,确保每一个级别的映射都对应到了最根部(可以联系参考链接1的内容进行理解,虽然这里没有使用Union的数据结构,但是本质上还是一个树形的结构,需要做一个重映射);然后用second_pass执行Two-Pass算法的第二次遍历,得到一组打上了新的独立标签的网格节点;最后需要用flatten将标签进行压平,因为前面映射的关系,有可能导致标签不连续,所以我们这里又做了一次映射,确保标签是连续变化的,实际应用中可以不使用这一步。
标签的重映射
关于节点的遍历,大家可以直接看算法代码,这里需要额外讲解的是标签的重映射模块的代码:
def remap(idx_dict) -> dict:
    index_dict = deepcopy(idx_dict)
    for id in idx_dict:
        idv = idx_dict[id]
        while idv in idx_dict:
            if idv == idx_dict[idv]:
                break
            idv = idx_dict[idv]
        index_dict[id] = idv
    return index_dict
这里的算法是先对得到的标签进行遍历,在字典中获取当前标索引所对应的值,作为新的索引,直到键跟值一致为止,相当于在一个树形的数据结构中重复寻找父节点直到找到根节点。
其他的测试用例
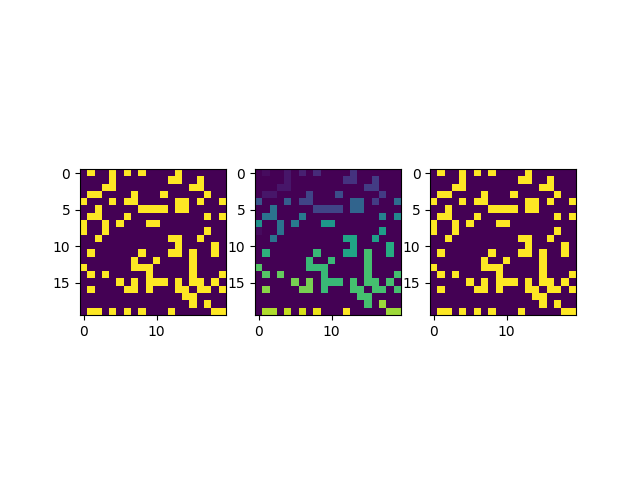
这里我们可以再额外测试一些案例,比如增加几个0元素使得网格节点更加稀疏:
graph = np.random.choice([0,0,0,1],size=(20,20))
得到的结果图片如下所示:
还可以再稀疏一些:
graph = np.random.choice([0,0,0,0,0,1],size=(20,20))
得到的结果如下图所示:
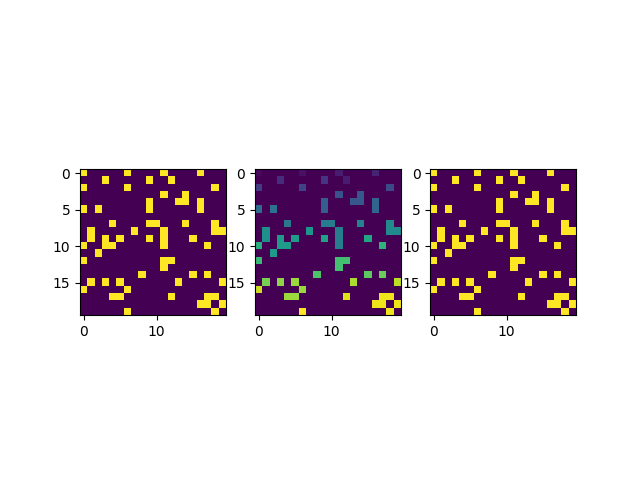
越是稀疏的图,得到的分组结果就越分散。
总结概要
在本文中我们主要介绍了利用Two-Pass的算法来检测区域连通性,并给出了Python3的代码实现,当然在实现的过程中因为没有使用到Union这样的数据结构,仅仅用了字典来存储标签之间的关系,因此效率和代码可读性都会低一些,单纯作为用例的演示和小规模区域划分的计算是足够用了。在该代码实现方案中,还有一点与原始算法不一致的是,本实现方案中打新的标签是读取上、上左和左三个方向的格点,但是存储标签的映射关系时,是读取了上、上左、上右和左这四个方向的格点。
参考链接
- https://blog.csdn.net/lichengyu/article/details/13986521
- https://www.cnblogs.com/riddick/p/8280883.html
到此这篇关于运用Python3实现Two-Pass算法检测区域连通性的文章就介绍到这了,更多相关Python3实现Two-Pass算法检测区域流通内容请搜索脚本之家以前的文章或继续浏览下面的相关文章希望大家以后多多支持脚本之家!


 咨 询 客 服