Elastic stack 俗称 ELK stack,是一组包括 Elasticsearch、Logstash 和 Kibana 在内的开源产品。Elastic Stack 由 Elastic 公司开发和维护。使用 Elastic stack,可以将系统日志发送到 Logstash,它是一个数据收集引擎,接受来自可能任何来源的日志或数据,并对日志进行归一化,然后将日志转发到 Elasticsearch,用于分析、索引、搜索和存储,最后使用 Kibana 表示为可视化数据,使用 Kibana,我们还可以基于用户的查询创建交互式图表。
在本文中,我们将演示如何在 RHEL 8 / CentOS 8 服务器上设置多节点 elastic stack 集群。以下是我的 Elastic Stack 集群的详细信息:
Elasticsearch:
- 三台服务器,最小化安装 RHEL 8 / CentOS 8
- IP & 主机名 – 192.168.56.40(
elasticsearch1.linuxtechi.local)、192.168.56.50 (elasticsearch2.linuxtechi.local)、192.168.56.60(elasticsearch3.linuxtechi.local`)
Logstash:**
- 两台服务器,最小化安装 RHEL 8 / CentOS 8
- IP & 主机 – 192.168.56.20(
logstash1.linuxtechi.local)、192.168.56.30(logstash2.linuxtechi.local)
Kibana:
一台服务器,最小化安装 RHEL 8 / CentOS 8IP & 主机名 – 192.168.56.10(kibana.linuxtechi.local)
Filebeat:
- 一台服务器,最小化安装 CentOS 7
- IP & 主机名 – 192.168.56.70(
web-server)
让我们从设置 Elasticsearch 集群开始,
设置3个节点 Elasticsearch 集群
正如我已经说过的,设置 Elasticsearch 集群的节点,登录到每个节点,设置主机名并配置 yum/dnf 库
使用命令 hostnamectl 设置各个节点上的主机名:
[root@linuxtechi ~]# hostnamectl set-hostname "elasticsearch1.linuxtechi. local"
[root@linuxtechi ~]# exec bash
[root@linuxtechi ~]#
[root@linuxtechi ~]# hostnamectl set-hostname "elasticsearch2.linuxtechi. local"
[root@linuxtechi ~]# exec bash
[root@linuxtechi ~]#
[root@linuxtechi ~]# hostnamectl set-hostname "elasticsearch3.linuxtechi. local"
[root@linuxtechi ~]# exec bash
[root@linuxtechi ~]#
对于 CentOS 8 系统,我们不需要配置任何操作系统包库,对于 RHEL 8 服务器,如果你有有效订阅,那么用红帽订阅以获得包存储库就可以了。如果你想为操作系统包配置本地 yum/dnf 存储库,请参考以下网址:
如何使用 DVD 或 ISO 文件在 RHEL 8 服务器上设置本地 Yum / DNF 存储库
在所有节点上配置 Elasticsearch 包存储库,在 /etc/yum.repo.d/ 文件夹下创建一个包含以下内容的 elastic.repo 文件:
~]# vi /etc/yum.repos.d/elastic.repo
[elasticsearch-7.x]
name=Elasticsearch repository for 7.x packages
baseurl=https://artifacts.elastic.co/packages/7.x/yum
gpgcheck=1
gpgkey=https://artifacts.elastic.co/GPG-KEY-elasticsearch
enabled=1
autorefresh=1
type=rpm-md
保存文件并退出。
在所有三个节点上使用 rpm 命令导入 Elastic 公共签名密钥。
~]# rpm --import https://artifacts.elastic.co/GPG-KEY-elasticsearch
在所有三个节点的 /etc/hosts 文件中添加以下行:
192.168.56.40  elasticsearch1.linuxtechi.local
192.168.56.50  elasticsearch2.linuxtechi.local
192.168.56.60  elasticsearch3.linuxtechi.local
使用 yum/dnf 命令在所有三个节点上安装 Java:
[root@linuxtechi ~]# dnf install java-openjdk -y
[root@linuxtechi ~]# dnf install java-openjdk -y
[root@linuxtechi ~]# dnf install java-openjdk -y
使用 yum/dnf 命令在所有三个节点上安装 Elasticsearch:
root@linuxtechi ~]# dnf install elasticsearch -y
[root@linuxtechi ~]# dnf install elasticsearch -y
[root@linuxtechi ~]# dnf install elasticsearch -y
注意: 如果操作系统防火墙已启用并在每个 Elasticsearch 节点中运行,则使用 firewall-cmd 命令允许以下端口开放:
~]# firewall-cmd --permanent --add-port=9300/tcp
~]# firewall-cmd --permanent --add-port=9200/tcp
~]# firewall-cmd --reload
配置 Elasticsearch, 在所有节点上编辑文件 /etc/elasticsearch/elasticsearch.yml 并加入以下内容:
~]# vim /etc/elasticsearch/elasticsearch.yml
cluster.name: opn-cluster
node.name: elasticsearch1.linuxtechi.local
network.host: 192.168.56.40
http.port: 9200
discovery.seed_hosts: ["elasticsearch1.linuxtechi.local", "elasticsearch2.linuxtechi.local", "elasticsearch3.linuxtechi.local"]
cluster.initial_master_nodes: ["elasticsearch1.linuxtechi.local", "elasticsearch2.linuxtechi.local", "elasticsearch3.linuxtechi.local"]
注意: 在每个节点上,在 node.name 中填写正确的主机名,在 network.host 中填写正确的 IP 地址,其他参数保持不变。
现在使用 systemctl 命令在所有三个节点上启动并启用 Elasticsearch 服务:
~]# systemctl daemon-reload
~]# systemctl enable elasticsearch.service
~]# systemctl start elasticsearch.service
使用下面 ss 命令验证 elasticsearch 节点是否开始监听 9200 端口:
[root@linuxtechi ~]# ss -tunlp | grep 9200
tcp LISTEN 0 128 [::ffff:192.168.56.40]:9200  *:* users:(("java",pid=2734,fd=256))
[root@linuxtechi ~]#
使用以下 curl 命令验证 Elasticsearch 群集状态:
[root@linuxtechi ~]# curl http://elasticsearch1.linuxtechi.local:9200
[root@linuxtechi ~]# curl -X GET http://elasticsearch2.linuxtechi.local:9200/_cluster/health?pretty
命令的输出如下所示:
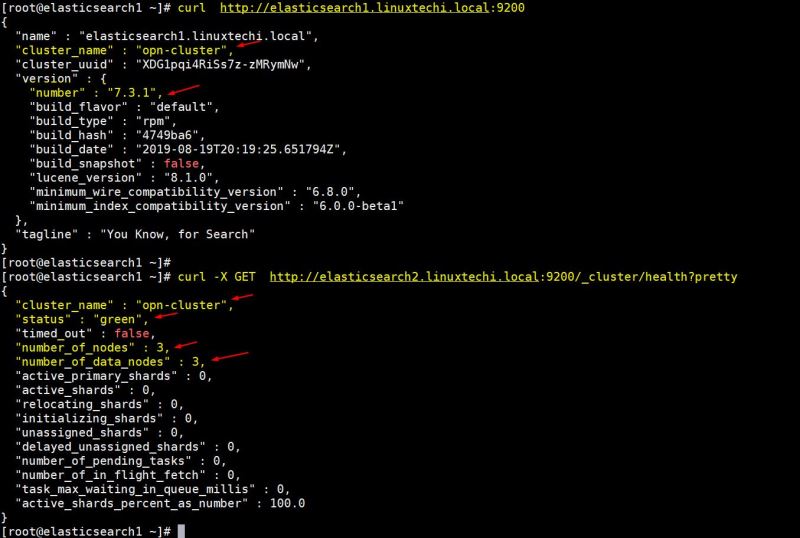
以上输出表明我们已经成功创建了 3 节点的 Elasticsearch 集群,集群的状态也是绿色的。
注意: 如果你想修改 JVM 堆大小,那么你可以编辑了文件 /etc/elasticsearch/jvm.options,并根据你的环境更改以下参数
现在让我们转到 Logstash 节点。
安装和配置 Logstash
在两个 Logstash 节点上执行以下步骤。
登录到两个节点使用 hostnamectl 命令设置主机名:
[root@linuxtechi ~]# hostnamectl set-hostname "logstash1.linuxtechi.local"
[root@linuxtechi ~]# exec bash
[root@linuxtechi ~]#
[root@linuxtechi ~]# hostnamectl set-hostname "logstash2.linuxtechi.local"
[root@linuxtechi ~]# exec bash
[root@linuxtechi ~]#
在两个 logstash 节点的 /etc/hosts 文件中添加以下条目:
~]# vi /etc/hosts
192.168.56.40  elasticsearch1.linuxtechi.local
192.168.56.50  elasticsearch2.linuxtechi.local
192.168.56.60  elasticsearch3.linuxtechi.local
保存文件并退出。
在两个节点上配置 Logstash 存储库,在文件夹 /ete/yum.repo.d/ 下创建一个包含以下内容的文件 logstash.repo:
~]# vi /etc/yum.repos.d/logstash.repo
[elasticsearch-7.x]
name=Elasticsearch repository for 7.x packages
baseurl=https://artifacts.elastic.co/packages/7.x/yum
gpgcheck=1
gpgkey=https://artifacts.elastic.co/GPG-KEY-elasticsearch
enabled=1
autorefresh=1
type=rpm-md
保存并退出文件,运行 rpm 命令导入签名密钥:
~]# rpm --import https://artifacts.elastic.co/GPG-KEY-elasticsearch
使用 yum/dnf 命令在两个节点上安装 Java OpenJDK:
~]# dnf install java-openjdk -y
从两个节点运行 yum/dnf 命令来安装 logstash:
[root@linuxtechi ~]# dnf install logstash -y
[root@linuxtechi ~]# dnf install logstash -y
现在配置 logstash,在两个 logstash 节点上执行以下步骤,创建一个 logstash 配置文件,首先我们在 /etc/logstash/conf.d/ 下复制 logstash 示例文件:
# cd /etc/logstash/
# cp logstash-sample.conf conf.d/logstash.conf
编辑配置文件并更新以下内容:
# vi conf.d/logstash.conf
input {
 beats {
 port => 5044
 }
}
output {
 elasticsearch {
 hosts => ["http://elasticsearch1.linuxtechi.local:9200", "http://elasticsearch2.linuxtechi.local:9200", "http://elasticsearch3.linuxtechi.local:9200"]
 index => "%{[@metadata][beat]}-%{[@metadata][version]}-%{+YYYY.MM.dd}"
 #user => "elastic"
 #password => "changeme"
 }
}
在 output 部分之下,在 hosts 参数中指定所有三个 Elasticsearch 节点的 FQDN,其他参数保持不变。
使用 firewall-cmd 命令在操作系统防火墙中允许 logstash 端口 “5044”:
~ # firewall-cmd --permanent --add-port=5044/tcp
~ # firewall-cmd –reload
现在,在每个节点上运行以下 systemctl 命令,启动并启用 Logstash 服务:
~]# systemctl start logstash
~]# systemctl eanble logstash
使用 ss 命令验证 logstash 服务是否开始监听 5044 端口:
[root@linuxtechi ~]# ss -tunlp | grep 5044
tcp LISTEN 0 128    *:5044  *:* users:(("java",pid=2416,fd=96))
[root@linuxtechi ~]#
以上输出表明 logstash 已成功安装和配置。让我们转到 Kibana 安装。
安装和配置 Kibana
登录 Kibana 节点,使用 hostnamectl 命令设置主机名:
[root@linuxtechi ~]# hostnamectl set-hostname "kibana.linuxtechi.local"
[root@linuxtechi ~]# exec bash
[root@linuxtechi ~]#
编辑 /etc/hosts 文件并添加以下行:
192.168.56.40  elasticsearch1.linuxtechi.local
192.168.56.50  elasticsearch2.linuxtechi.local
192.168.56.60  elasticsearch3.linuxtechi.local
使用以下命令设置 Kibana 存储库:
[root@linuxtechi ~]# vi /etc/yum.repos.d/kibana.repo
[elasticsearch-7.x]
name=Elasticsearch repository for 7.x packages
baseurl=https://artifacts.elastic.co/packages/7.x/yum
gpgcheck=1
gpgkey=https://artifacts.elastic.co/GPG-KEY-elasticsearch
enabled=1
autorefresh=1
type=rpm-md
[root@linuxtechi ~]# rpm --import https://artifacts.elastic.co/GPG-KEY-elasticsearch
执行 yum/dnf 命令安装 kibana:
[root@linuxtechi ~]# yum install kibana -y
通过编辑 /etc/kibana/kibana.yml 文件,配置 Kibana:
[root@linuxtechi ~]# vim /etc/kibana/kibana.yml
…………
server.host: "kibana.linuxtechi.local"
server.name: "kibana.linuxtechi.local"
elasticsearch.hosts: ["http://elasticsearch1.linuxtechi.local:9200", "http://elasticsearch2.linuxtechi.local:9200", "http://elasticsearch3.linuxtechi.local:9200"]
…………
启用并启动 kibana 服务:
root@linuxtechi ~]# systemctl start kibana
[root@linuxtechi ~]# systemctl enable kibana
在系统防火墙上允许 Kibana 端口 “5601”:
[root@linuxtechi ~]# firewall-cmd --permanent --add-port=5601/tcp
success
[root@linuxtechi ~]# firewall-cmd --reload
success
[root@linuxtechi ~]#
使用以下 URL 访问 Kibana 界面:http://kibana.linuxtechi.local:5601

从面板上,我们可以检查 Elastic Stack 集群的状态。
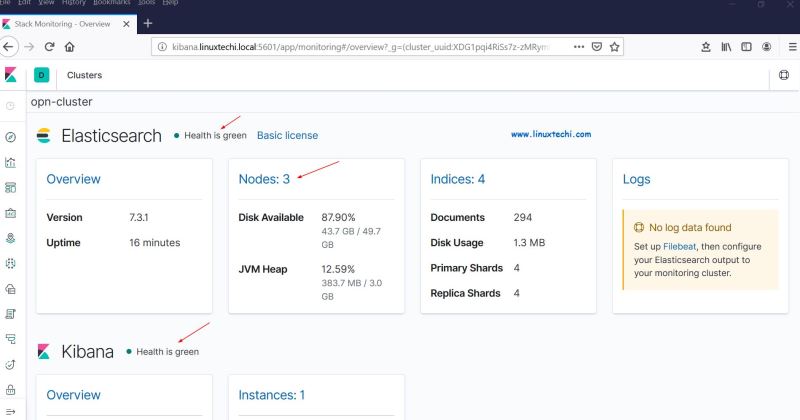
这证明我们已经在 RHEL 8 /CentOS 8 上成功地安装并设置了多节点 Elastic Stack 集群。
现在让我们通过 filebeat 从其他 Linux 服务器发送一些日志到 logstash 节点中,在我的例子中,我有一个 CentOS 7服务器,我将通过 filebeat 将该服务器的所有重要日志推送到 logstash。
登录到 CentOS 7 服务器使用 yum/rpm 命令安装 filebeat 包:
[root@linuxtechi ~]# rpm -ivh https://artifacts.elastic.co/downloads/beats/filebeat/filebeat-7.3.1-x86_64.rpm
Retrieving https://artifacts.elastic.co/downloads/beats/filebeat/filebeat-7.3.1-x86_64.rpm
Preparing...    ################################# [100%]
Updating / installing...
 1:filebeat-7.3.1-1   ################################# [100%]
[root@linuxtechi ~]#
编辑 /etc/hosts 文件并添加以下内容:
192.168.56.20  logstash1.linuxtechi.local
192.168.56.30  logstash2.linuxtechi.local
现在配置 filebeat,以便它可以使用负载平衡技术向 logstash 节点发送日志,编辑文件 /etc/filebeat/filebeat.yml,并添加以下参数:
在 filebeat.inputs: 部分将 enabled: false 更改为 enabled: true,并在 paths 参数下指定我们可以发送到 logstash 的日志文件的位置;注释掉 output.elasticsearch 和 host 参数;删除 output.logstash: 和 hosts: 的注释,并在 hosts 参数添加两个 logstash 节点,以及设置 loadbalance: true。
[root@linuxtechi ~]# vi /etc/filebeat/filebeat.yml
filebeat.inputs:
- type: log
 enabled: true
 paths:
 - /var/log/messages
 - /var/log/dmesg
 - /var/log/maillog
 - /var/log/boot.log
#output.elasticsearch:
 # hosts: ["localhost:9200"]
output.logstash:
 hosts: ["logstash1.linuxtechi.local:5044", "logstash2.linuxtechi.local:5044"]
 loadbalance: true
使用下面的 2 个 systemctl 命令 启动并启用 filebeat 服务:
[root@linuxtechi ~]# systemctl start filebeat
[root@linuxtechi ~]# systemctl enable filebeat
现在转到 Kibana 用户界面,验证新索引是否可见。
从左侧栏中选择管理选项,然后单击 Elasticsearch 下的索引管理:
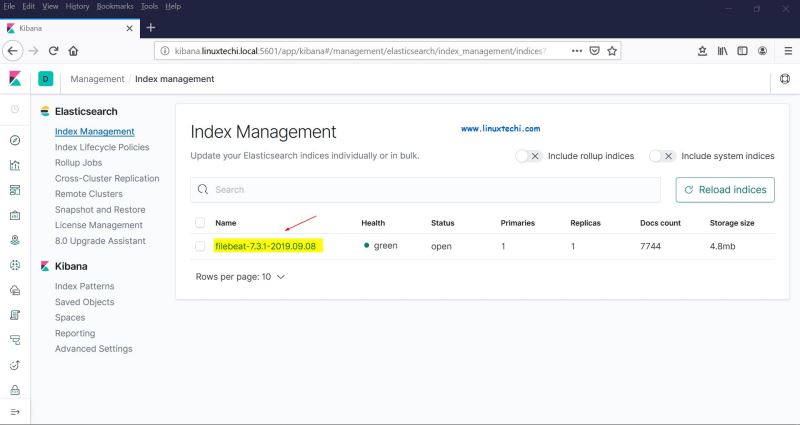
正如我们上面看到的,索引现在是可见的,让我们现在创建索引模型。
点击 Kibana 部分的 “Index Patterns”,它将提示我们创建一个新模型,点击 “Create Index Pattern” ,并将模式名称指定为 “filebeat”:
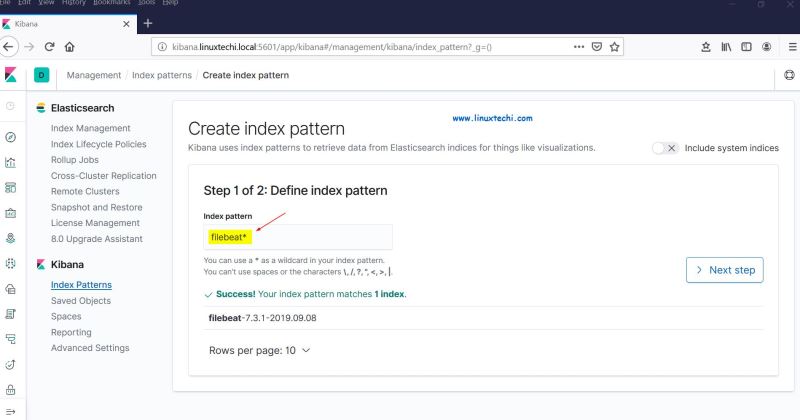
点击下一步。
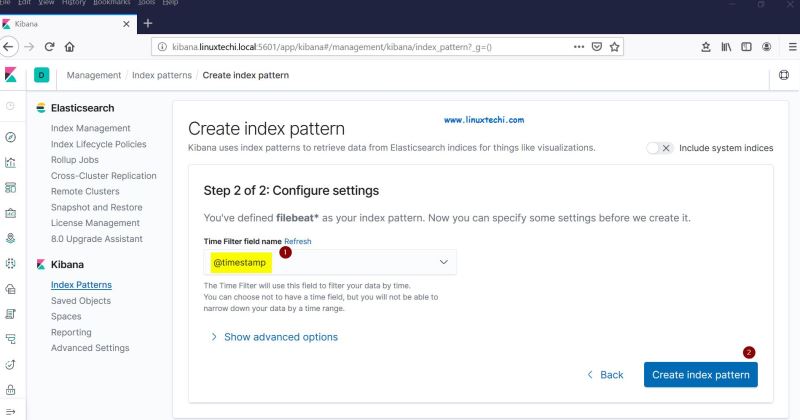
选择 “Timestamp” 作为索引模型的时间过滤器,然后单击 “Create index pattern”:
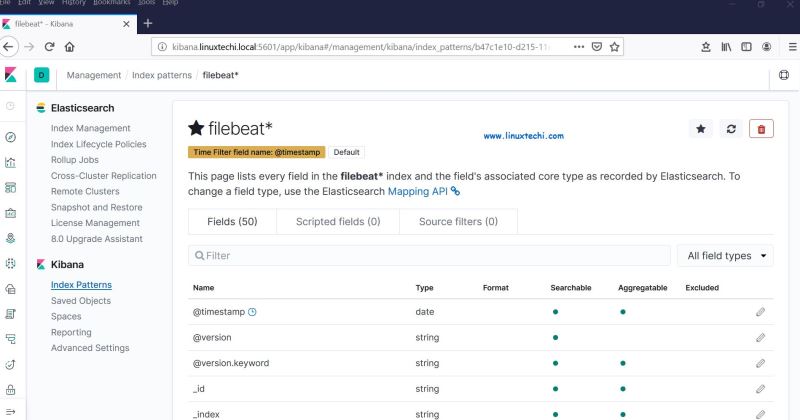
现在单击查看实时 filebeat 索引模型:
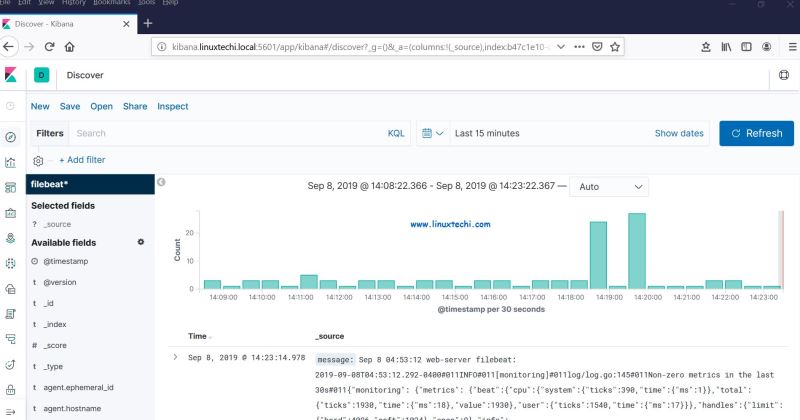
这表明 Filebeat 代理已配置成功,我们能够在 Kibana 仪表盘上看到实时日志。
以上就是本文的全部内容,对这些帮助你在 RHEL 8 / CentOS 8 系统上设置 Elastic Stack 集群的步骤,请不要犹豫分享你的反馈和意见。
via: https://www.linuxtechi.com/setup-multinode-elastic-stack-cluster-rhel8-centos8/
总结
以上所述是小编给大家介绍的在 RHEL8 /CentOS8 上建立多节点 Elastic stack 集群的方法,希望对大家有所帮助,如果大家有任何疑问请给我留言,小编会及时回复大家的。在此也非常感谢大家对脚本之家网站的支持!
如果你觉得本文对你有帮助,欢迎转载,烦请注明出处,谢谢!


 咨 询 客 服